| Presentations |
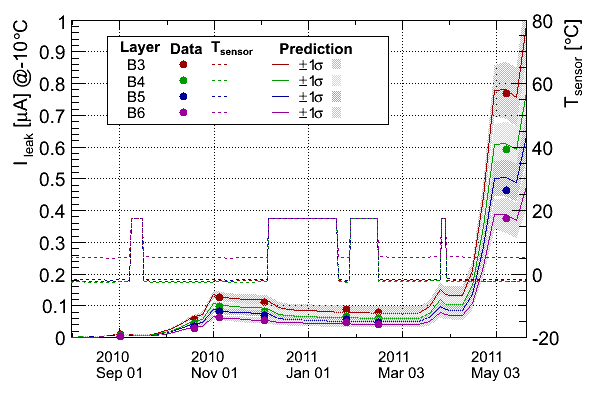
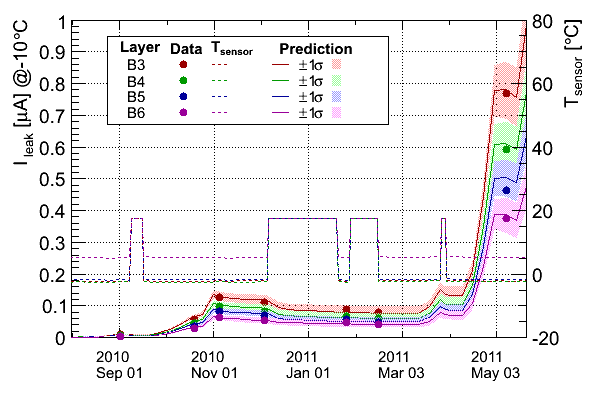
20110526(pdf,ppt), LeakCurrent_v2.pdf,
|
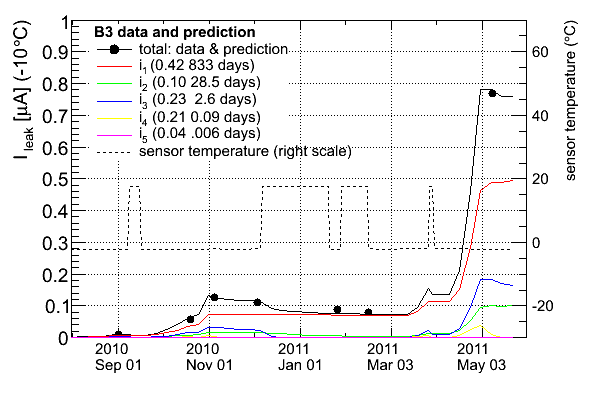
SCT_evolution_V9.pdf
SCT_evolution_V10.pdf
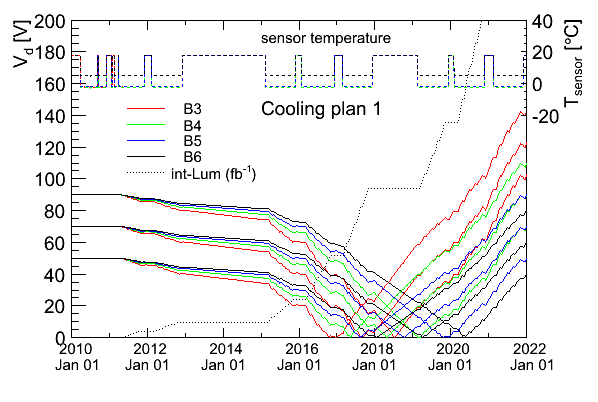
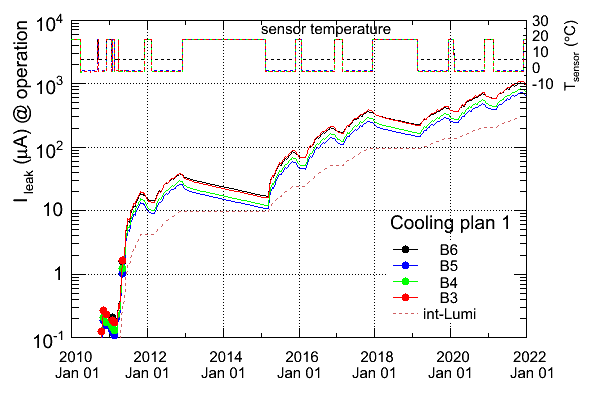
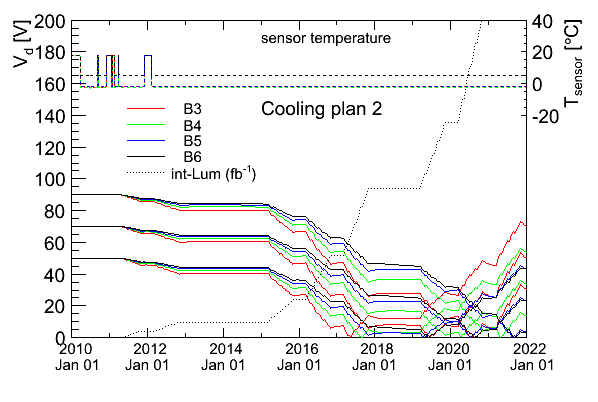
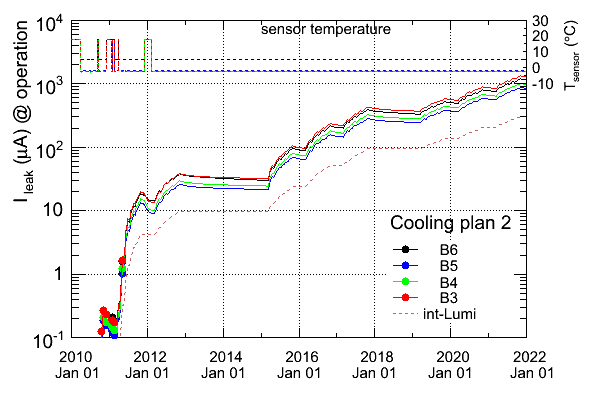
[1] Evolution of Depletion Voltage and Leakage Current
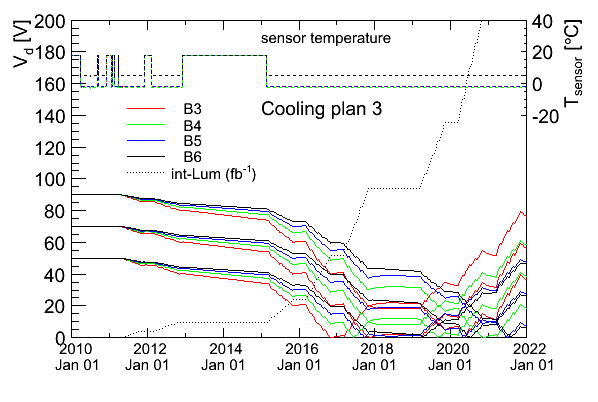
For presentations : SCT_evolution (ppt, pdf) updated version-8 (5 December, 2009)
Excel programme : Vd-Current.xls (updated 5 December, 2009)
Effect of cooling temperature in 2011 shutdown (ppt, pdf) 2010.1.21
Root programmes, data and plots:
| items | data | plot ROOT macros | plots | Figure No.
|
|---|
| TDR reproduction
| TDR_reprod.txt
| plot_TDR.C
| TDRreproduction.gif
| Fig. 1
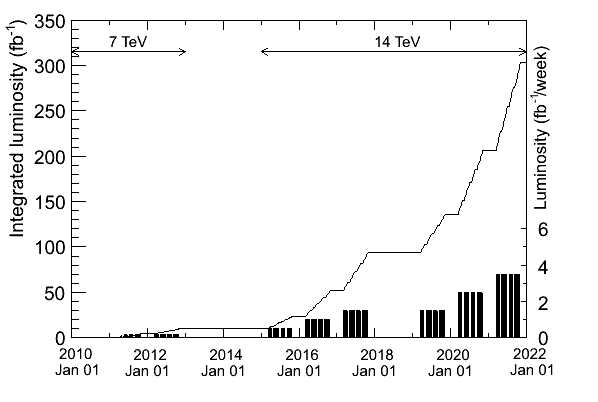
| | integrated luminosity | newest-intL.txt
| plot_fluence.C
| newest_integL.gif
| Fig. 2
| | fluence | neqFluence.txt |
plot_fluence.C
| fluence.gif
| Fig. 3
| | doping Neff_TDR | Neff_TDR.txt
| plot_Neff.C
| Neff_TDR.gif
| Fig. 4
| | doping Neff_Hamburg | Neff_Hamburg.txt
| plot_Neff.C
| Neff_Hamburg.gif
| Fig. 5
| | Full Depletion A
| Vd_scenarios.txt
newest-intL.txt
| plot_Vd.C
| Vd.gif
| Fig. 6
| | Vd A,B,D,G,I | Vd_scenarios.txt
newest-intL.txt
| plot_Vd_scenarios.C
| Vd_scenarios.gif
Vd_scenarios.eps
| Fig. 7
| | using n, p damages | Vd_npOnly.txt
| plot_Vd_npOnly.C
| Vd_npOnly.gif
| Fig. 8
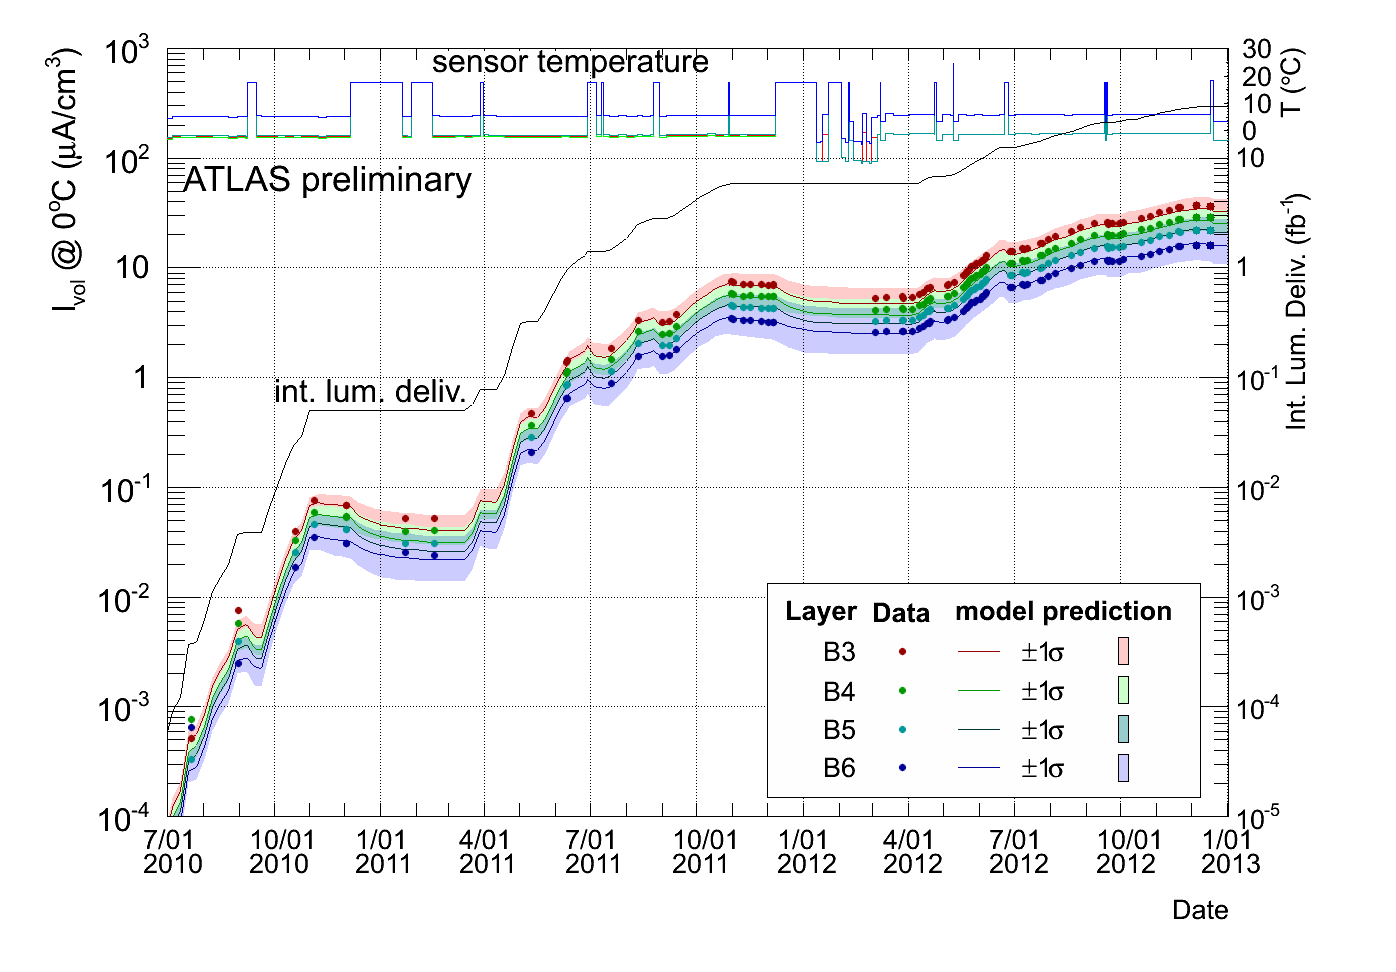
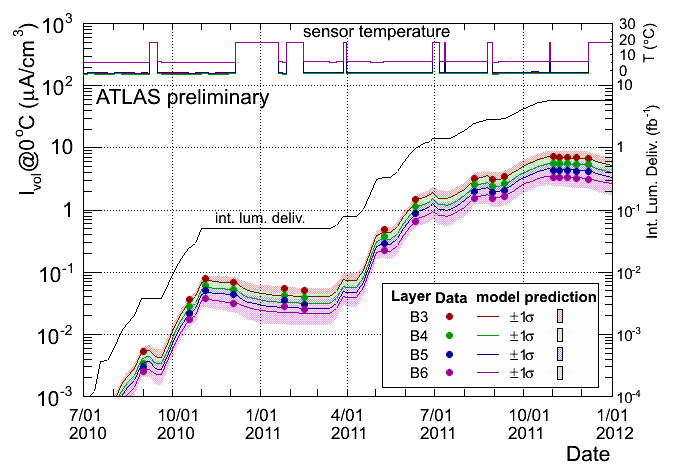
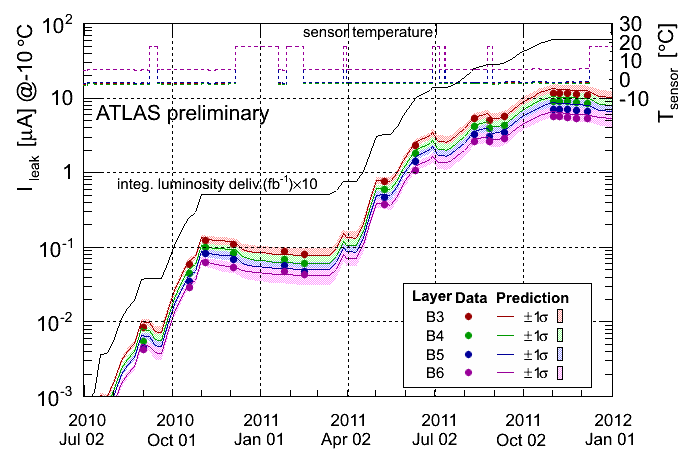
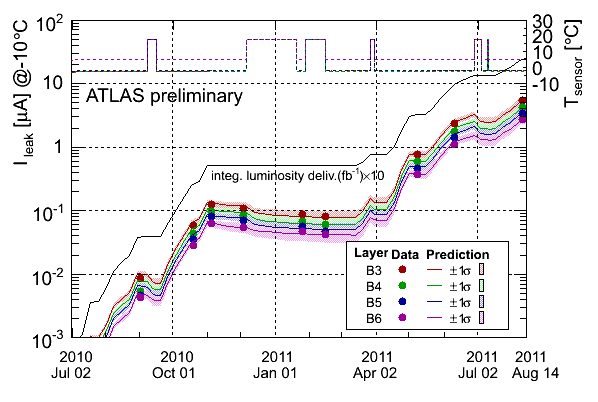
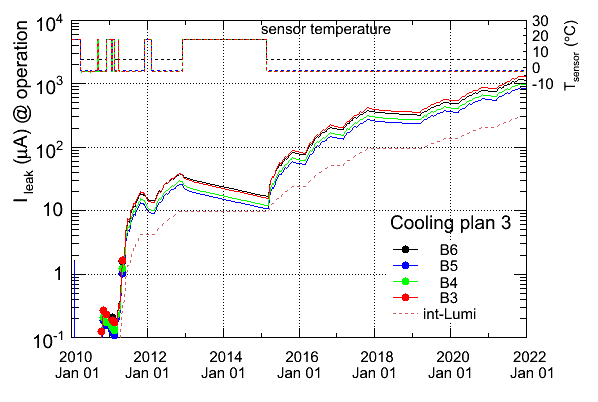
| | Leak current | I_scenarios.txt
| plot_I_scenarios.C
plot_I_scenarios_minus7.C
| I_OperatingT.gif , I_OperatingT.eps
I_minus.gif, I_minus.eps
| Fig. 9,10
| | model dependence of Ileak
| by Joost
| MollLogarithmicModel.xls
| Ileak.png
| Fig. 11
| | Bias Voltage
| BiasVoltage.txt
| plot_BiasVoltage.C
| BiasVoltage.gif
| Fig. 12
| | Voltage drop | Vdrop.txt
| plot_Vdrop.C
| Vdrop.gif
| Fig. 13
| | Power density | PowerDensity.txt
| plot_PowerDensity.C
| PowerDensity.gif
| Fig. 14
| | Total power
| TotalPower.txt
| plot_TotalPower.C
| TotalPower.gif | Fig. 15
| | runaway, plot-1
| runaway_year.txt
| plot_runaway_year_1.C
| runaway_year_1.gif
| Fig. 16
| | runaway, plot-2 | runaway_year.txt
| plot_runaway_year_2.C
| runaway_year_2.gif
| Fig. 17
| | runaway safety factor
| runaway_safetyFactor.txt
| plot_runaway_safetyFactor.C
| runaway_safetyFactor.gif
| Fig. 18
| | B3 on maintenance days
| maintenance_B3.txt
| plot_maint_Vd.C
| maintenance_Vd.gif
| Fig. 19
| | 1-year shutdown
| ShutdownEffects.txt
| plot_shutdown.C
| shutdown.png
| Fig. 20
| | B6 depletion V
| Vd_B6.txt
| plot_Vd_B6.C
| Vd_B6.gif
| Fig. 21
| | B6 leak current
| I_B6.txt
I_B6_minus7.txt
| plot_I_B6.C
plot_I_B6_minus7.C
| I_B6.gif , I_B6.eps
I_B6_minus7.gif , I_B6_minus7.eps
| Fig. 22
| | B6 total power
| TotalPower_B6.txt
| plot_TotalPower_B6.C
| TotalPower_B6.gif
| Fig. 23
| | runaway, plot-2 | runaway_year_B6.txt
| plot_runaway_year_2_B6.C
| runaway_B6.gif
| Fig. 24
| | Sensor Temperature
| temperature_new.txt
| plot_Tsensor_TDR.C
| Temperature_TDR.gif
| Fig. 25
| | Sensor Temperature
| temperature_new.txt
| plot_Tsensor_Hamburg.C
| Temperature_Hamburg.gif
| Fig. 26
|
Excel programmes for constant Tcoollant: Vd-Current_constTcool.xls (1 Oct. 2009)
First meeting on SCT temperature requirements at Glasgow on 14 May 2009
Meeting agenda
Presentation by Paul Dervan (pdf)
Presentation by Taka Kondo (pdf)
|
