ATLAS SCT: How to read HV, HVCurrent and Hybrid Temperature
2014.11.24c Taka Kondo (KEK)
[1] dcsDB.pl を使う方法
- lxplus.cern.chの自分の作業directoryに以下をコピーする。
dcsDB.pl ,
DCS_B3.sh, DCS_B4.sh, DCS_B5.sh, DCS_B6.sh
DCS_AIM.sh, DCS_CIM.sh,
DCS_AO.sh, DCS_CO.sh
- > source DCS_B3.sh で実行すると dcsHVchVolt_B3_17-11-2014.txt, dcsHVchCurr_B3_17-11-2014.txt,
dcsMOch_Tm0_B3_17-11-2014.txt, dcsMOch_Tm0_B3_17-11-2014.txt ができる。
- (注意)このような作業を続けると lxplus 上の残り領域が次第に少なくなる(> fs lq で調べられる)。その時は、home directoryに戻ってoradiag_usernameを消す(> rm -rf oradiag_username)。
- ROOT を起動して
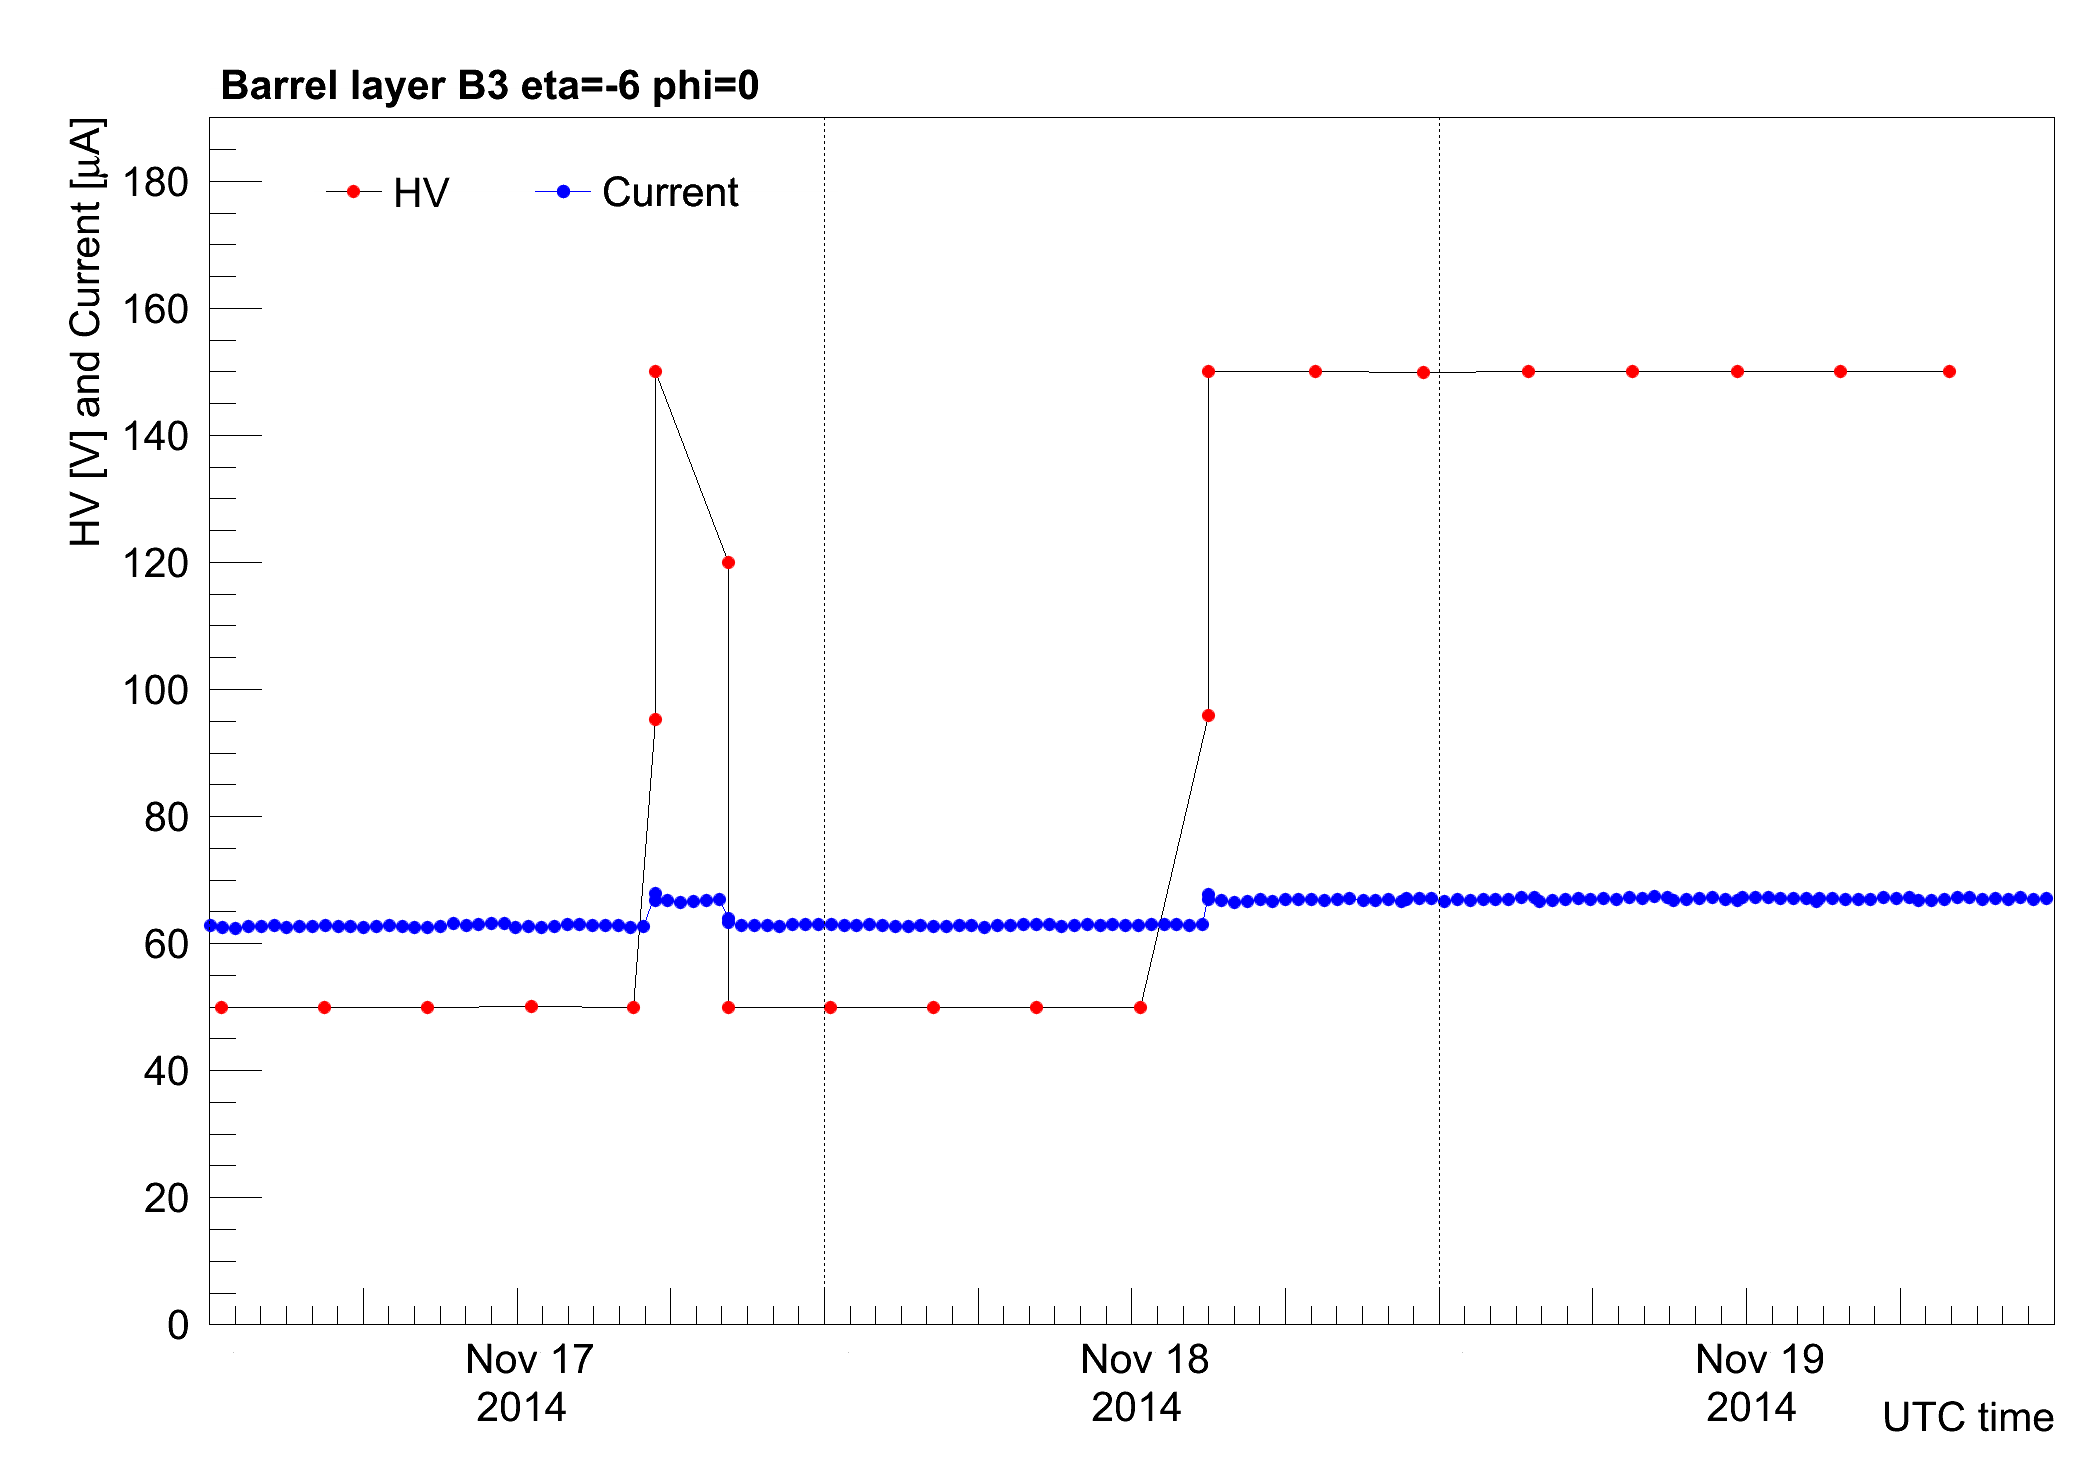
root [0] .x plot_HVCurrentDB_time.C
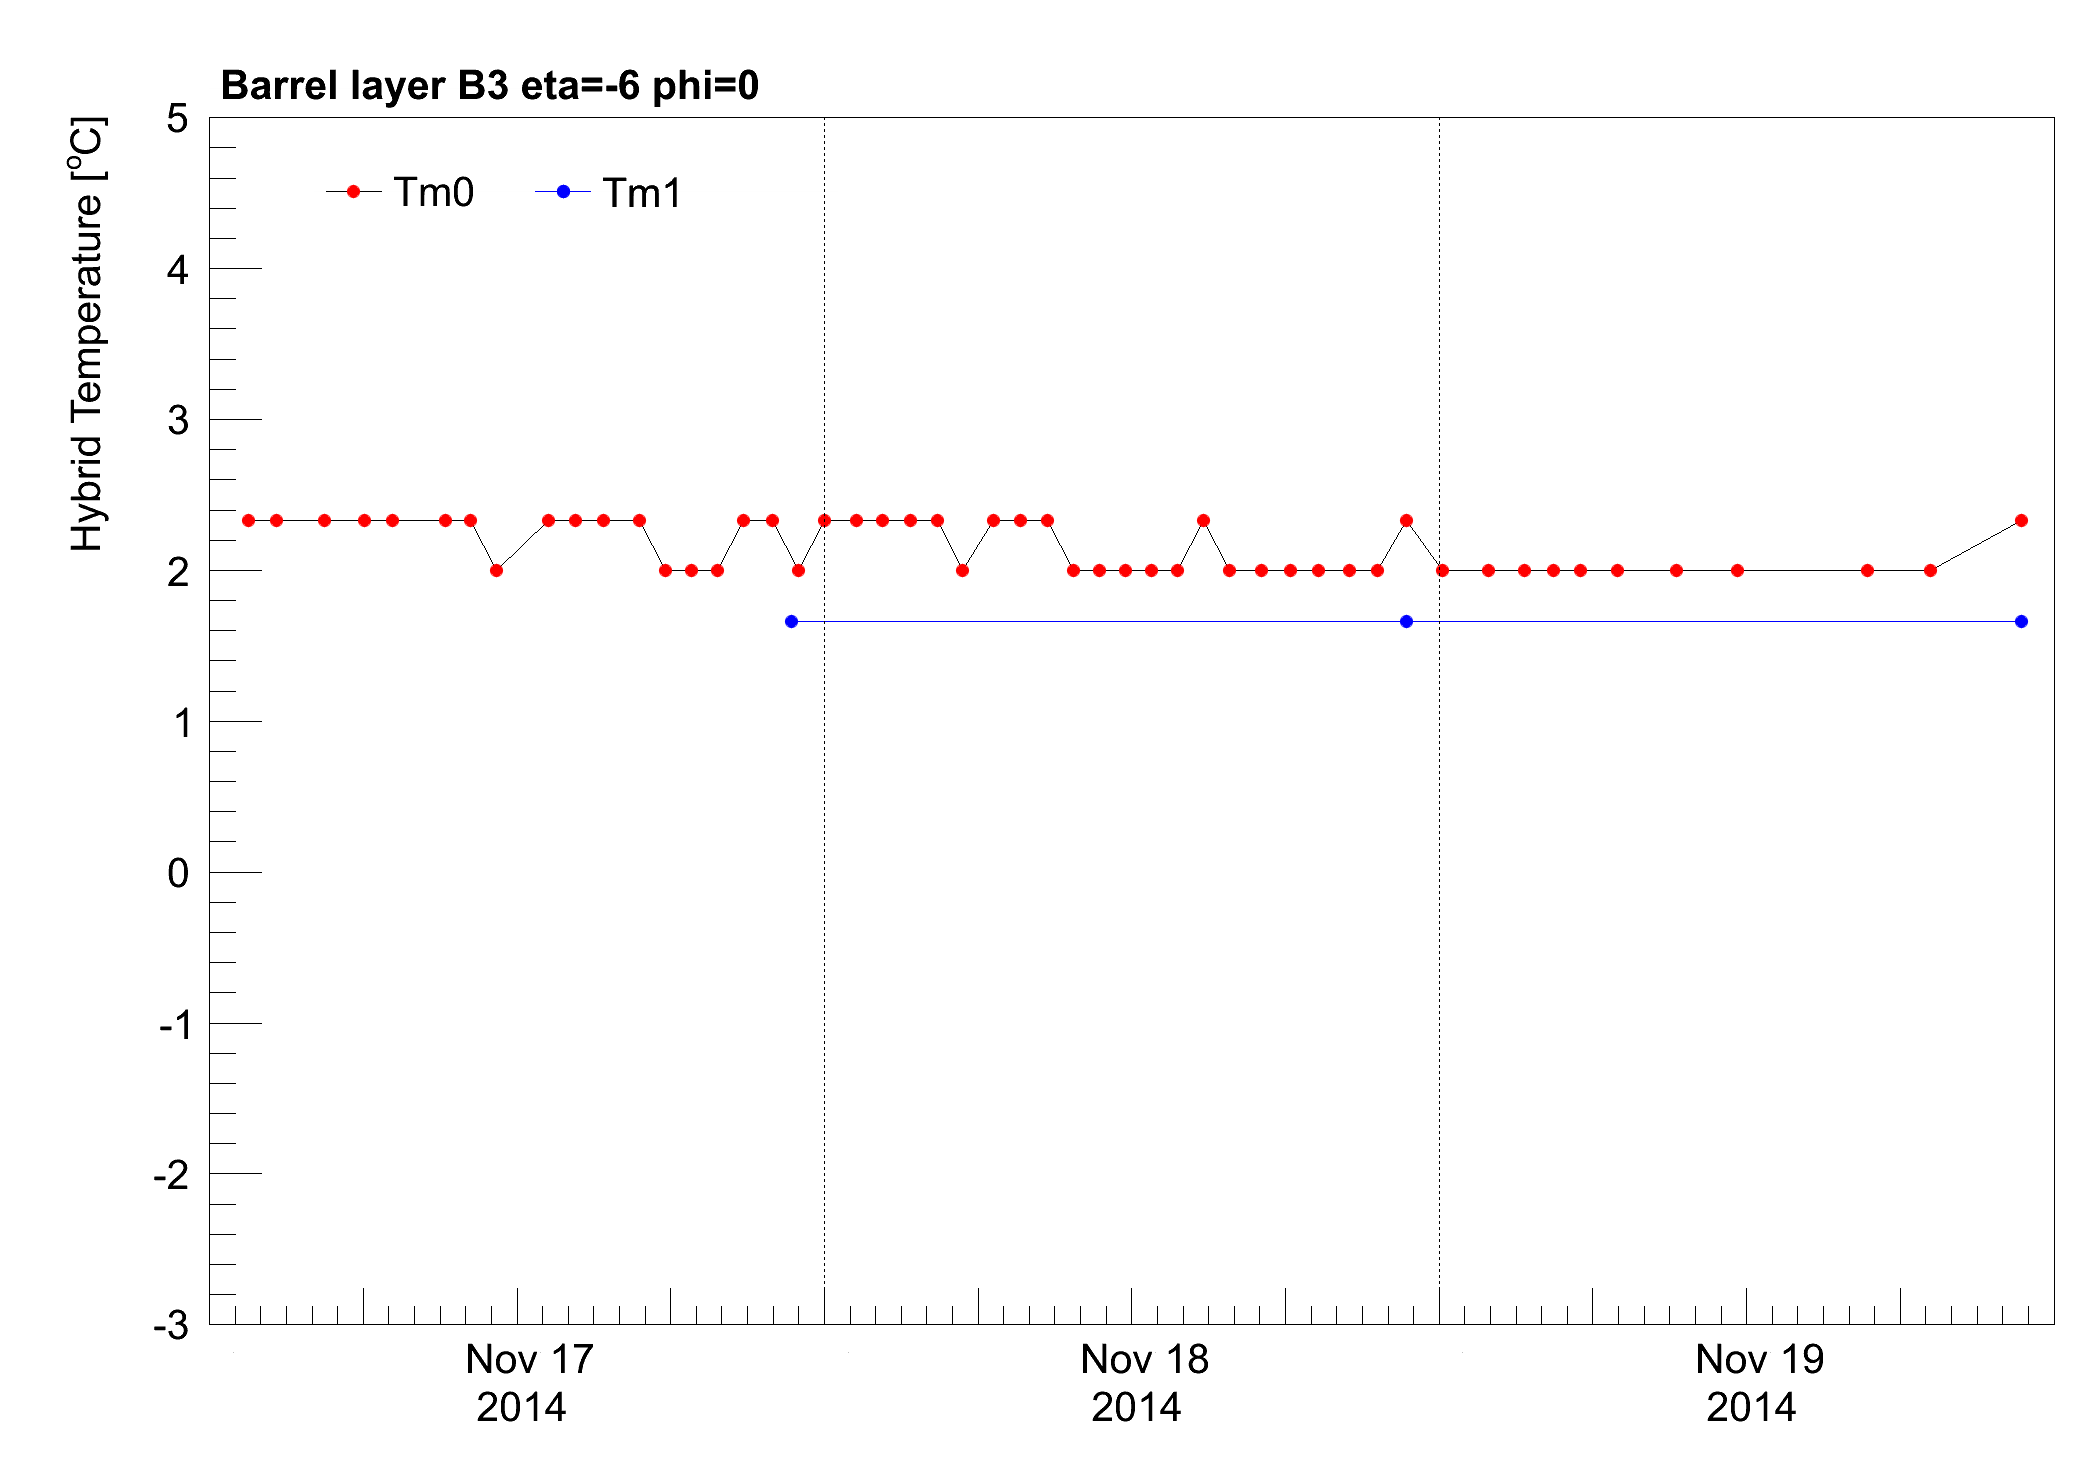
root [0] .x plot_TemperatureDB_time.C
と走らせればHVDB_time_B3_2014-11-17_0.png, TempDB_time_B3_2014-11-17_0.pngなどのプロットが作られる。
- モジュール毎の平均値を計算するプログラム dcsDB_average.cxx, dcsDB_average_EC.cxx, を
> g++ dcsDB_average.cxx でコンパイルし
> ./a.out で実行すると meanHVchCurr_B_19-11-2014.txtなどができる。
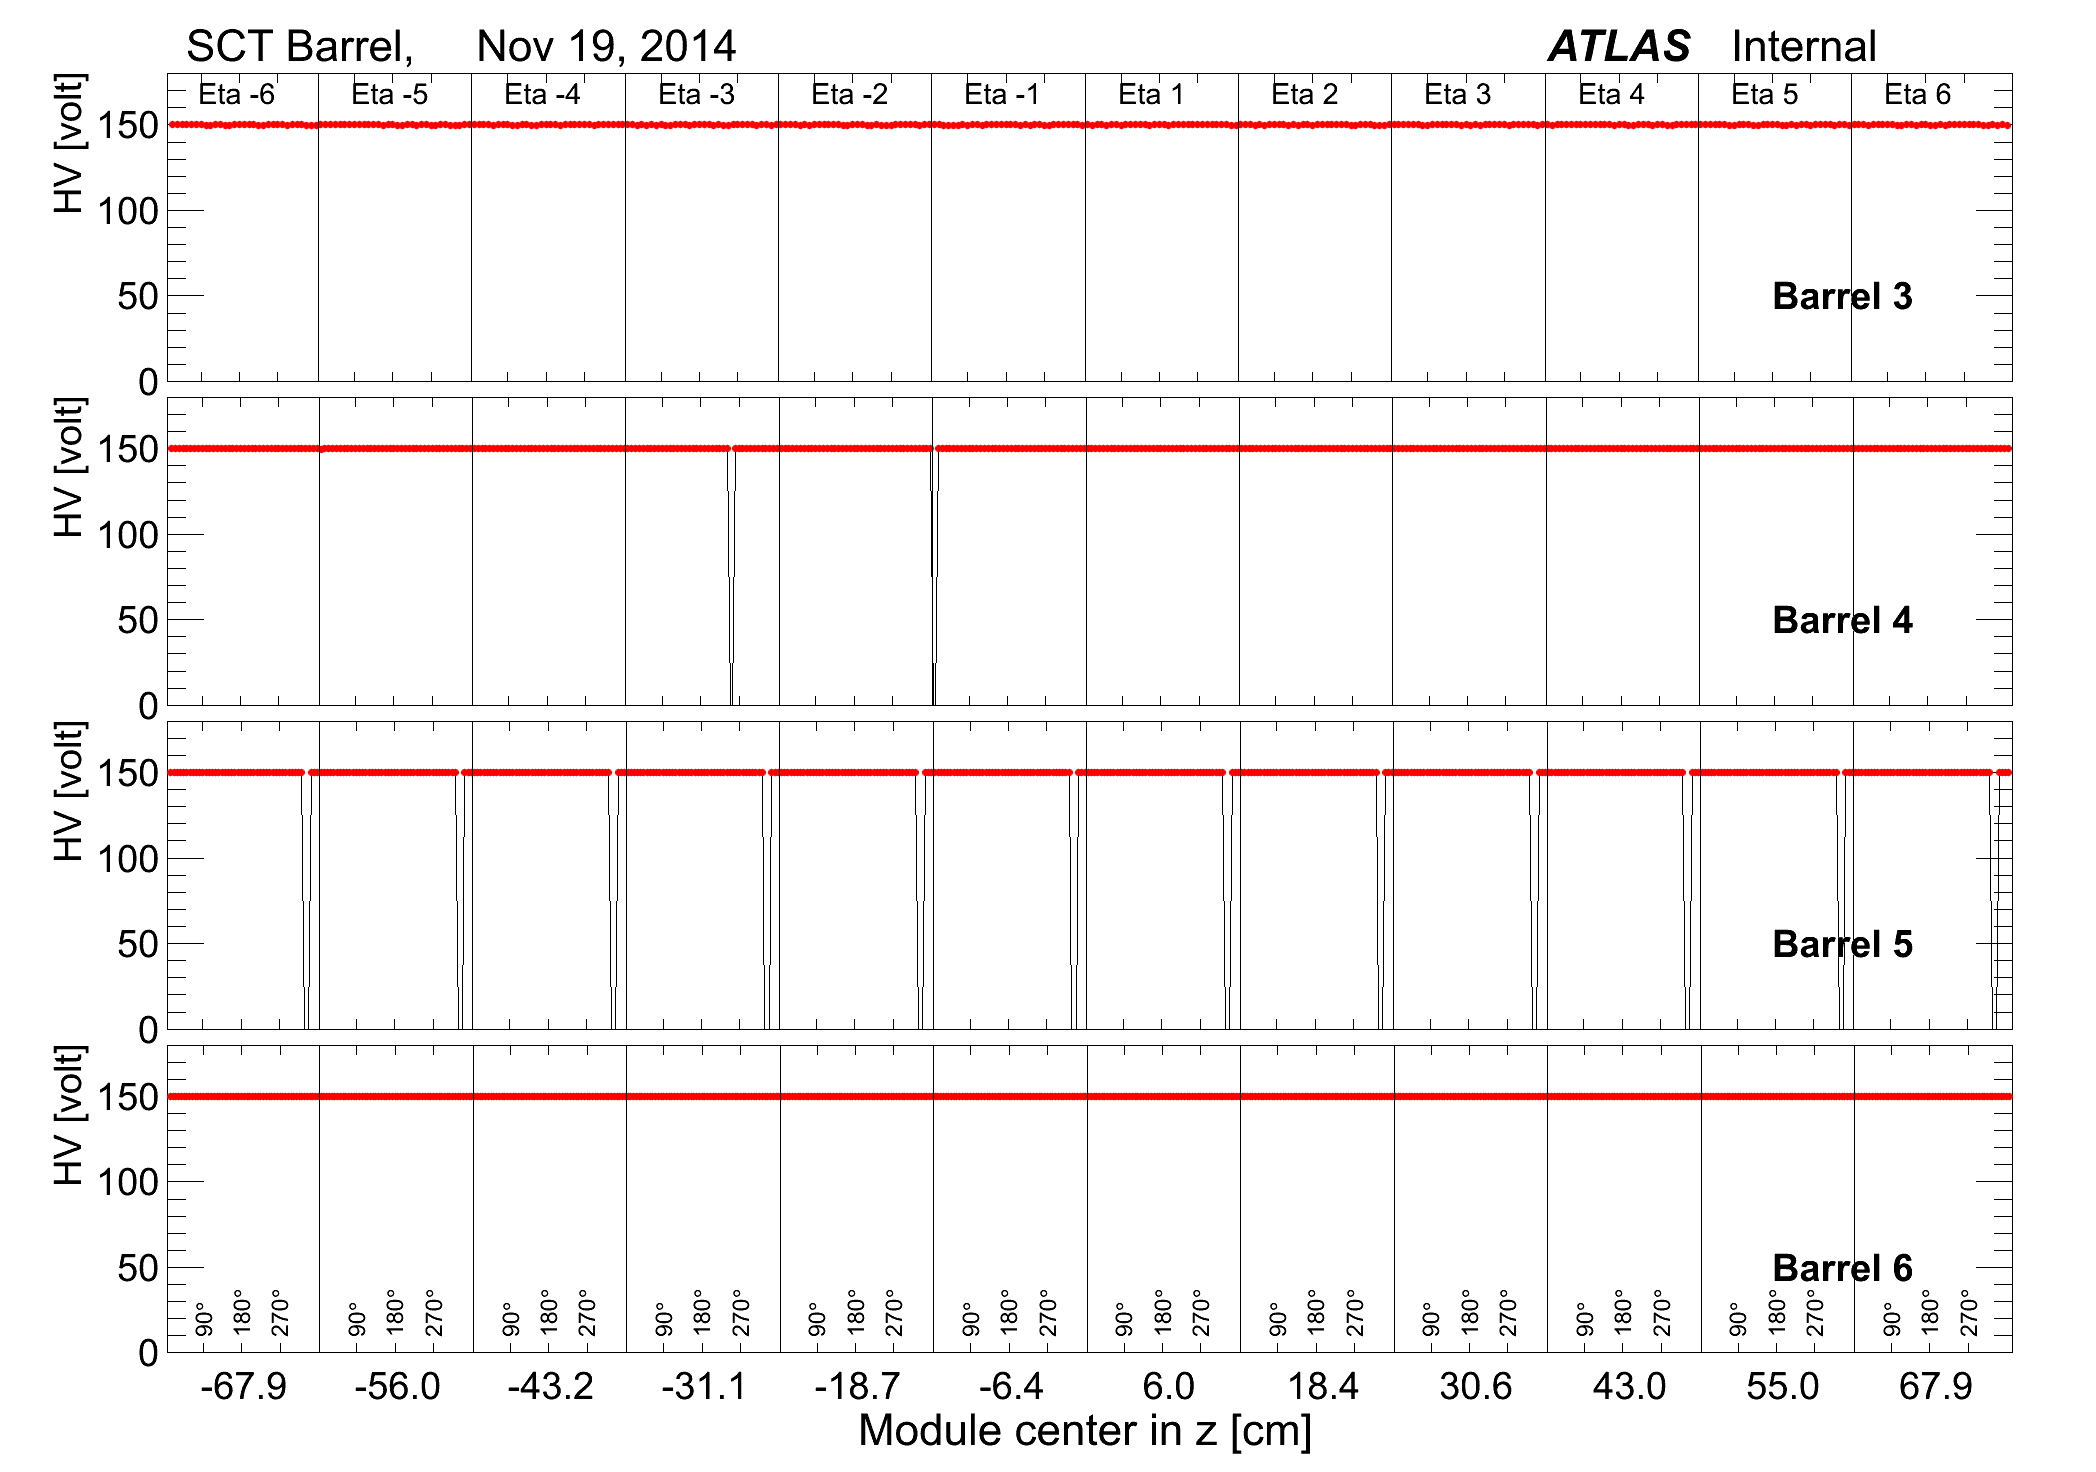
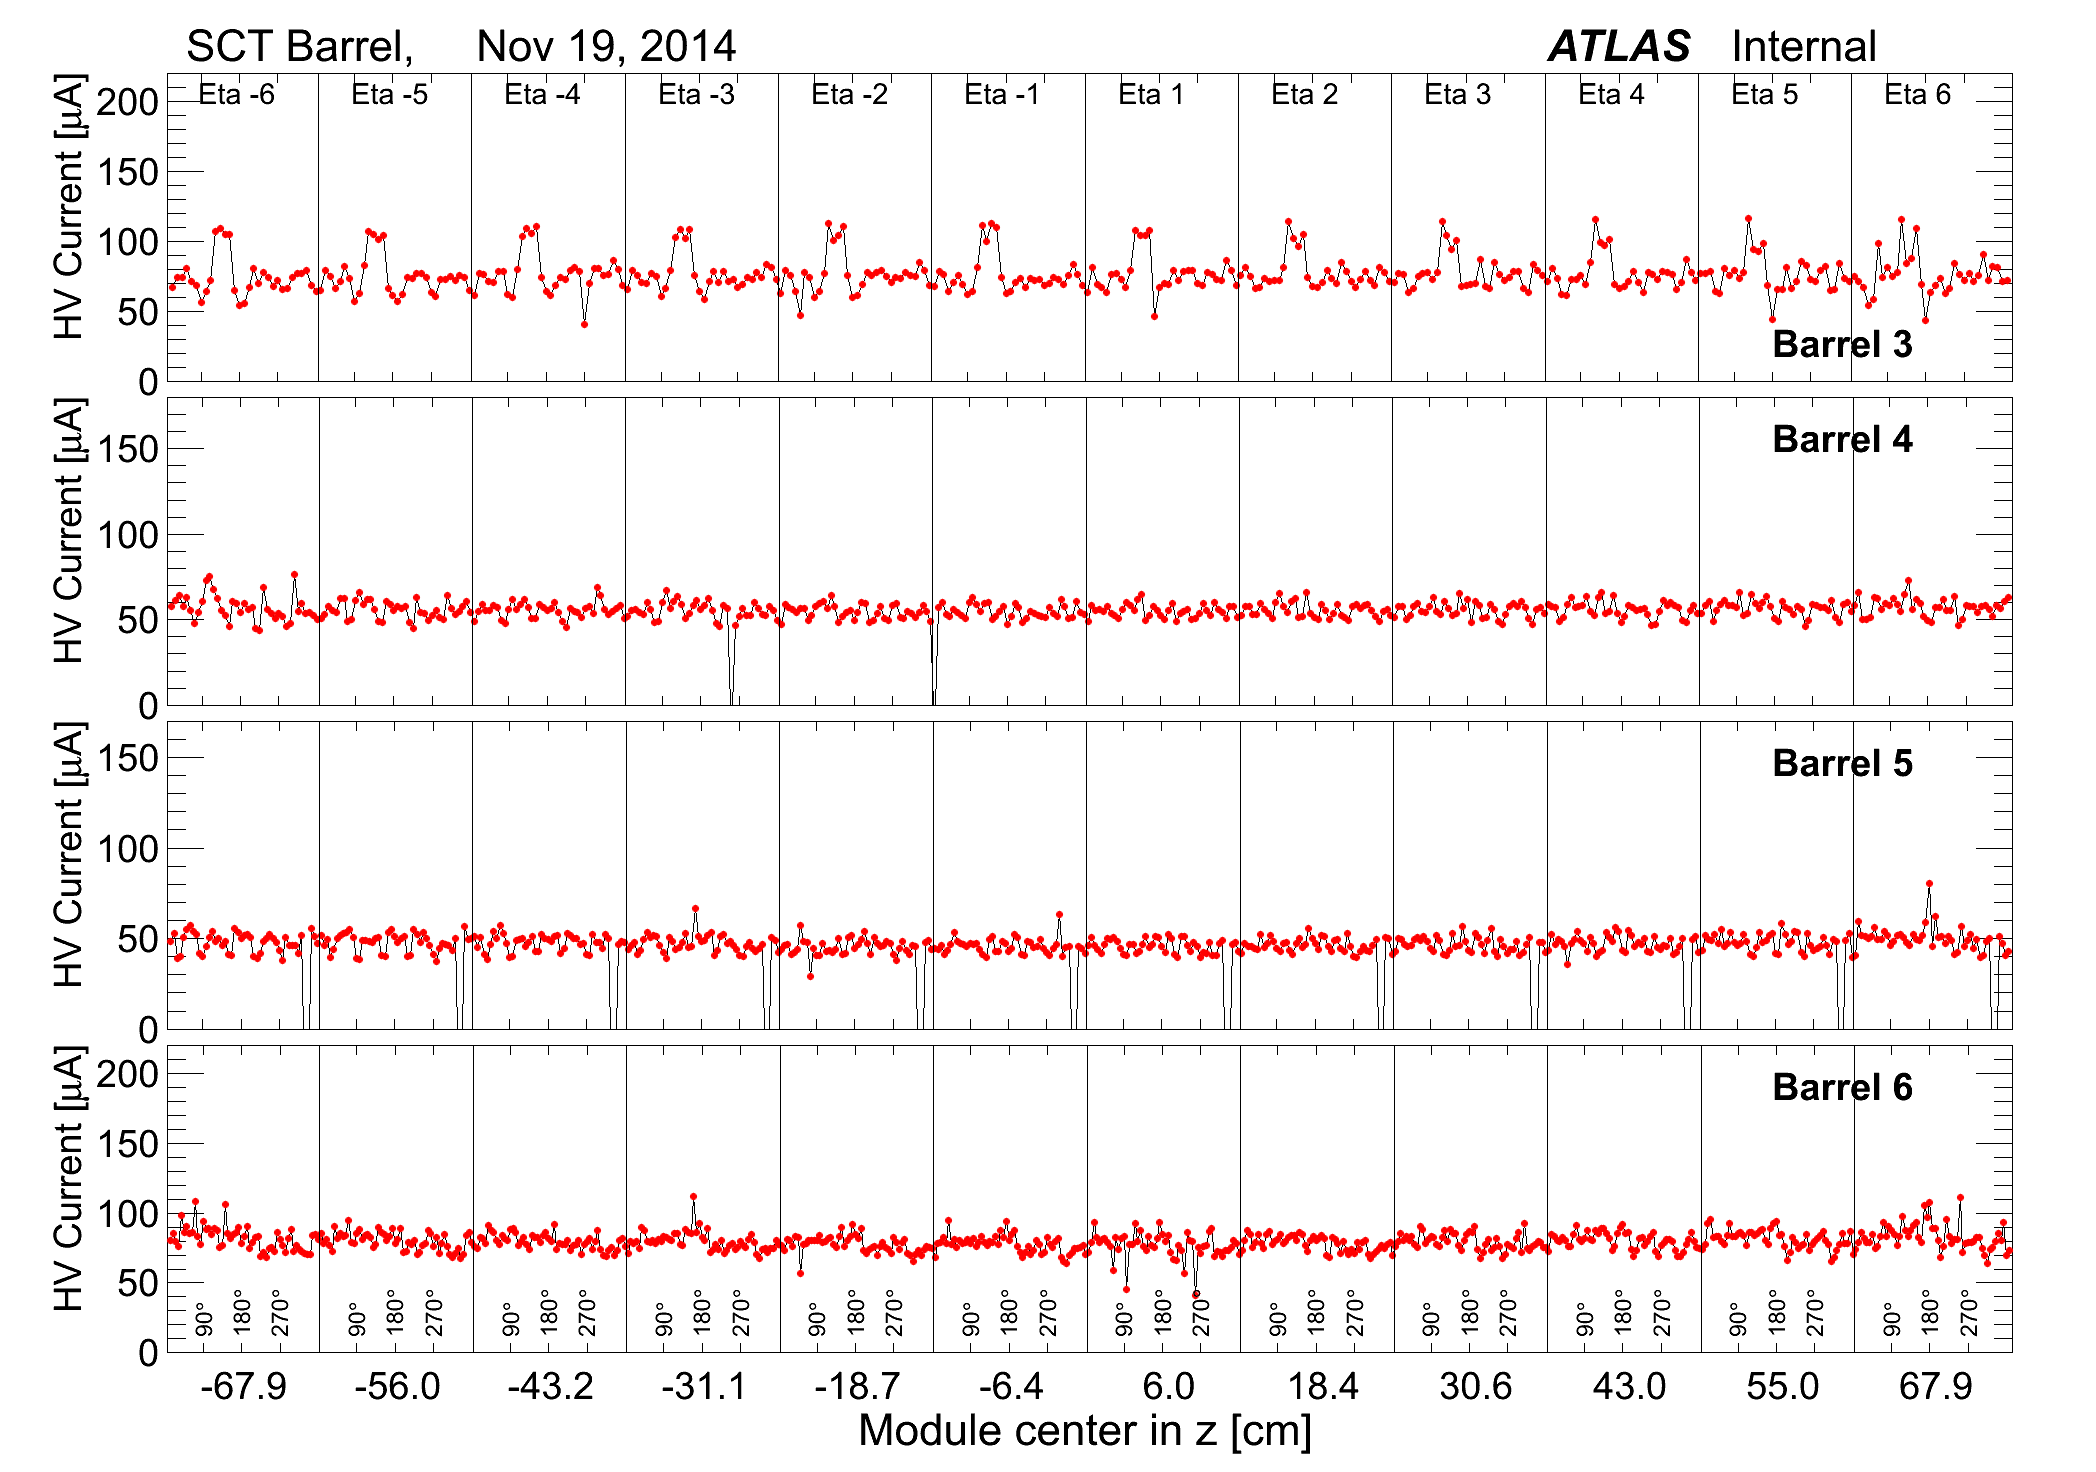
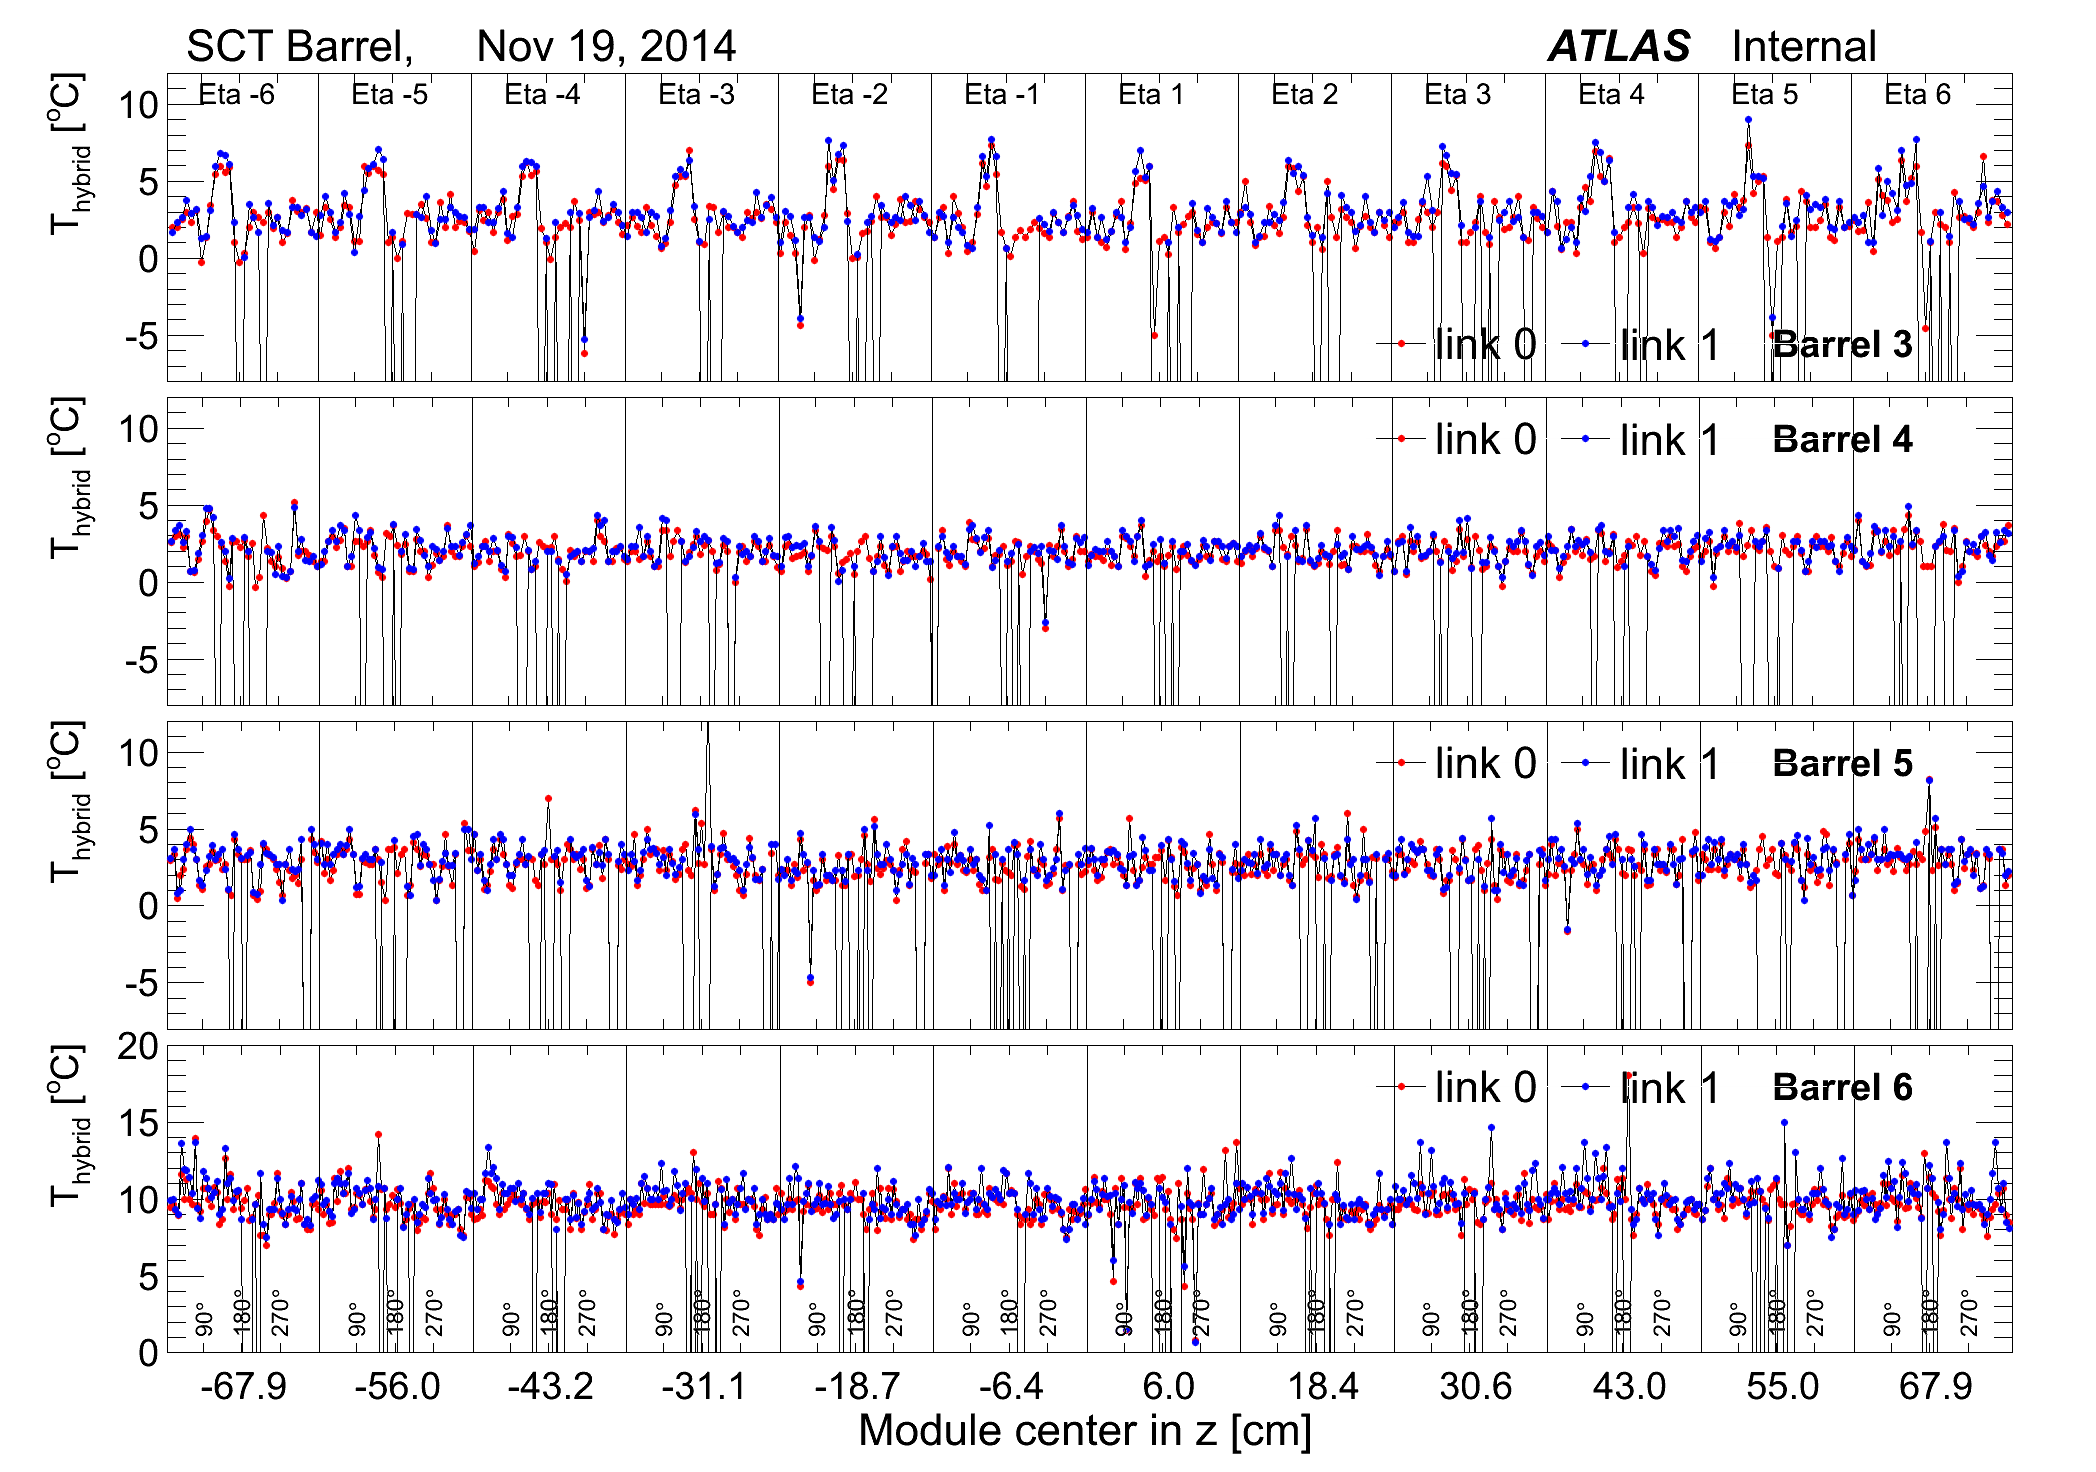
- Barrel分布:ROOT を起動してplot_dcsDB_Barrel.C(中でTYPE=1,2,3を指定する)を走らせれば、HV分布, HVchCurr分布, 温度分布が出る。
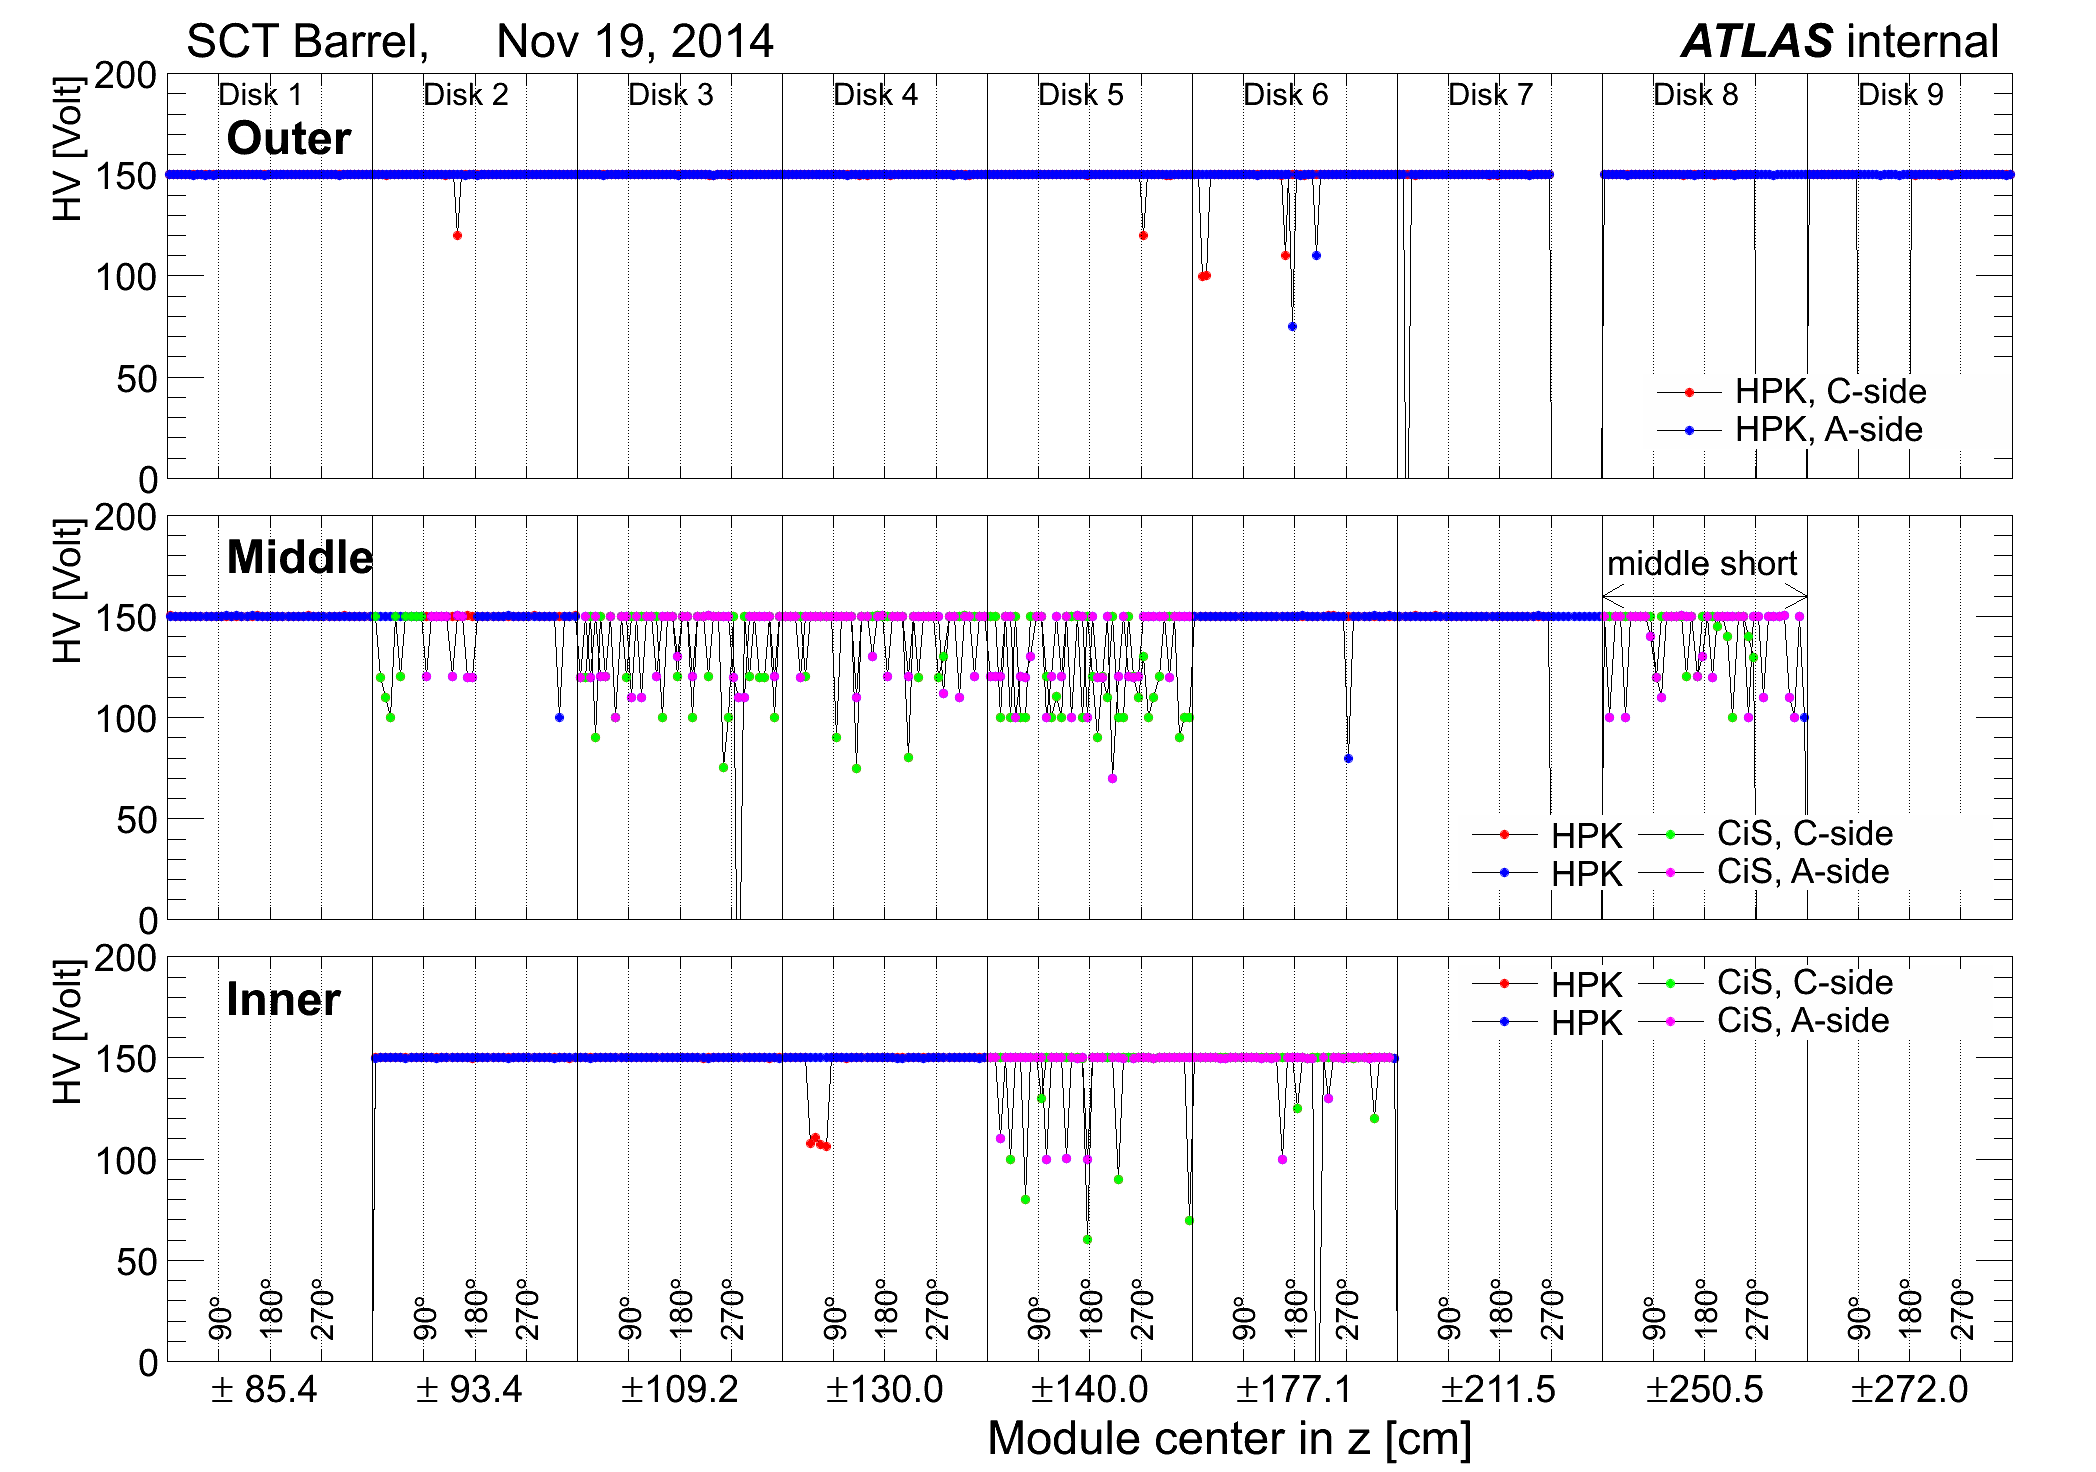
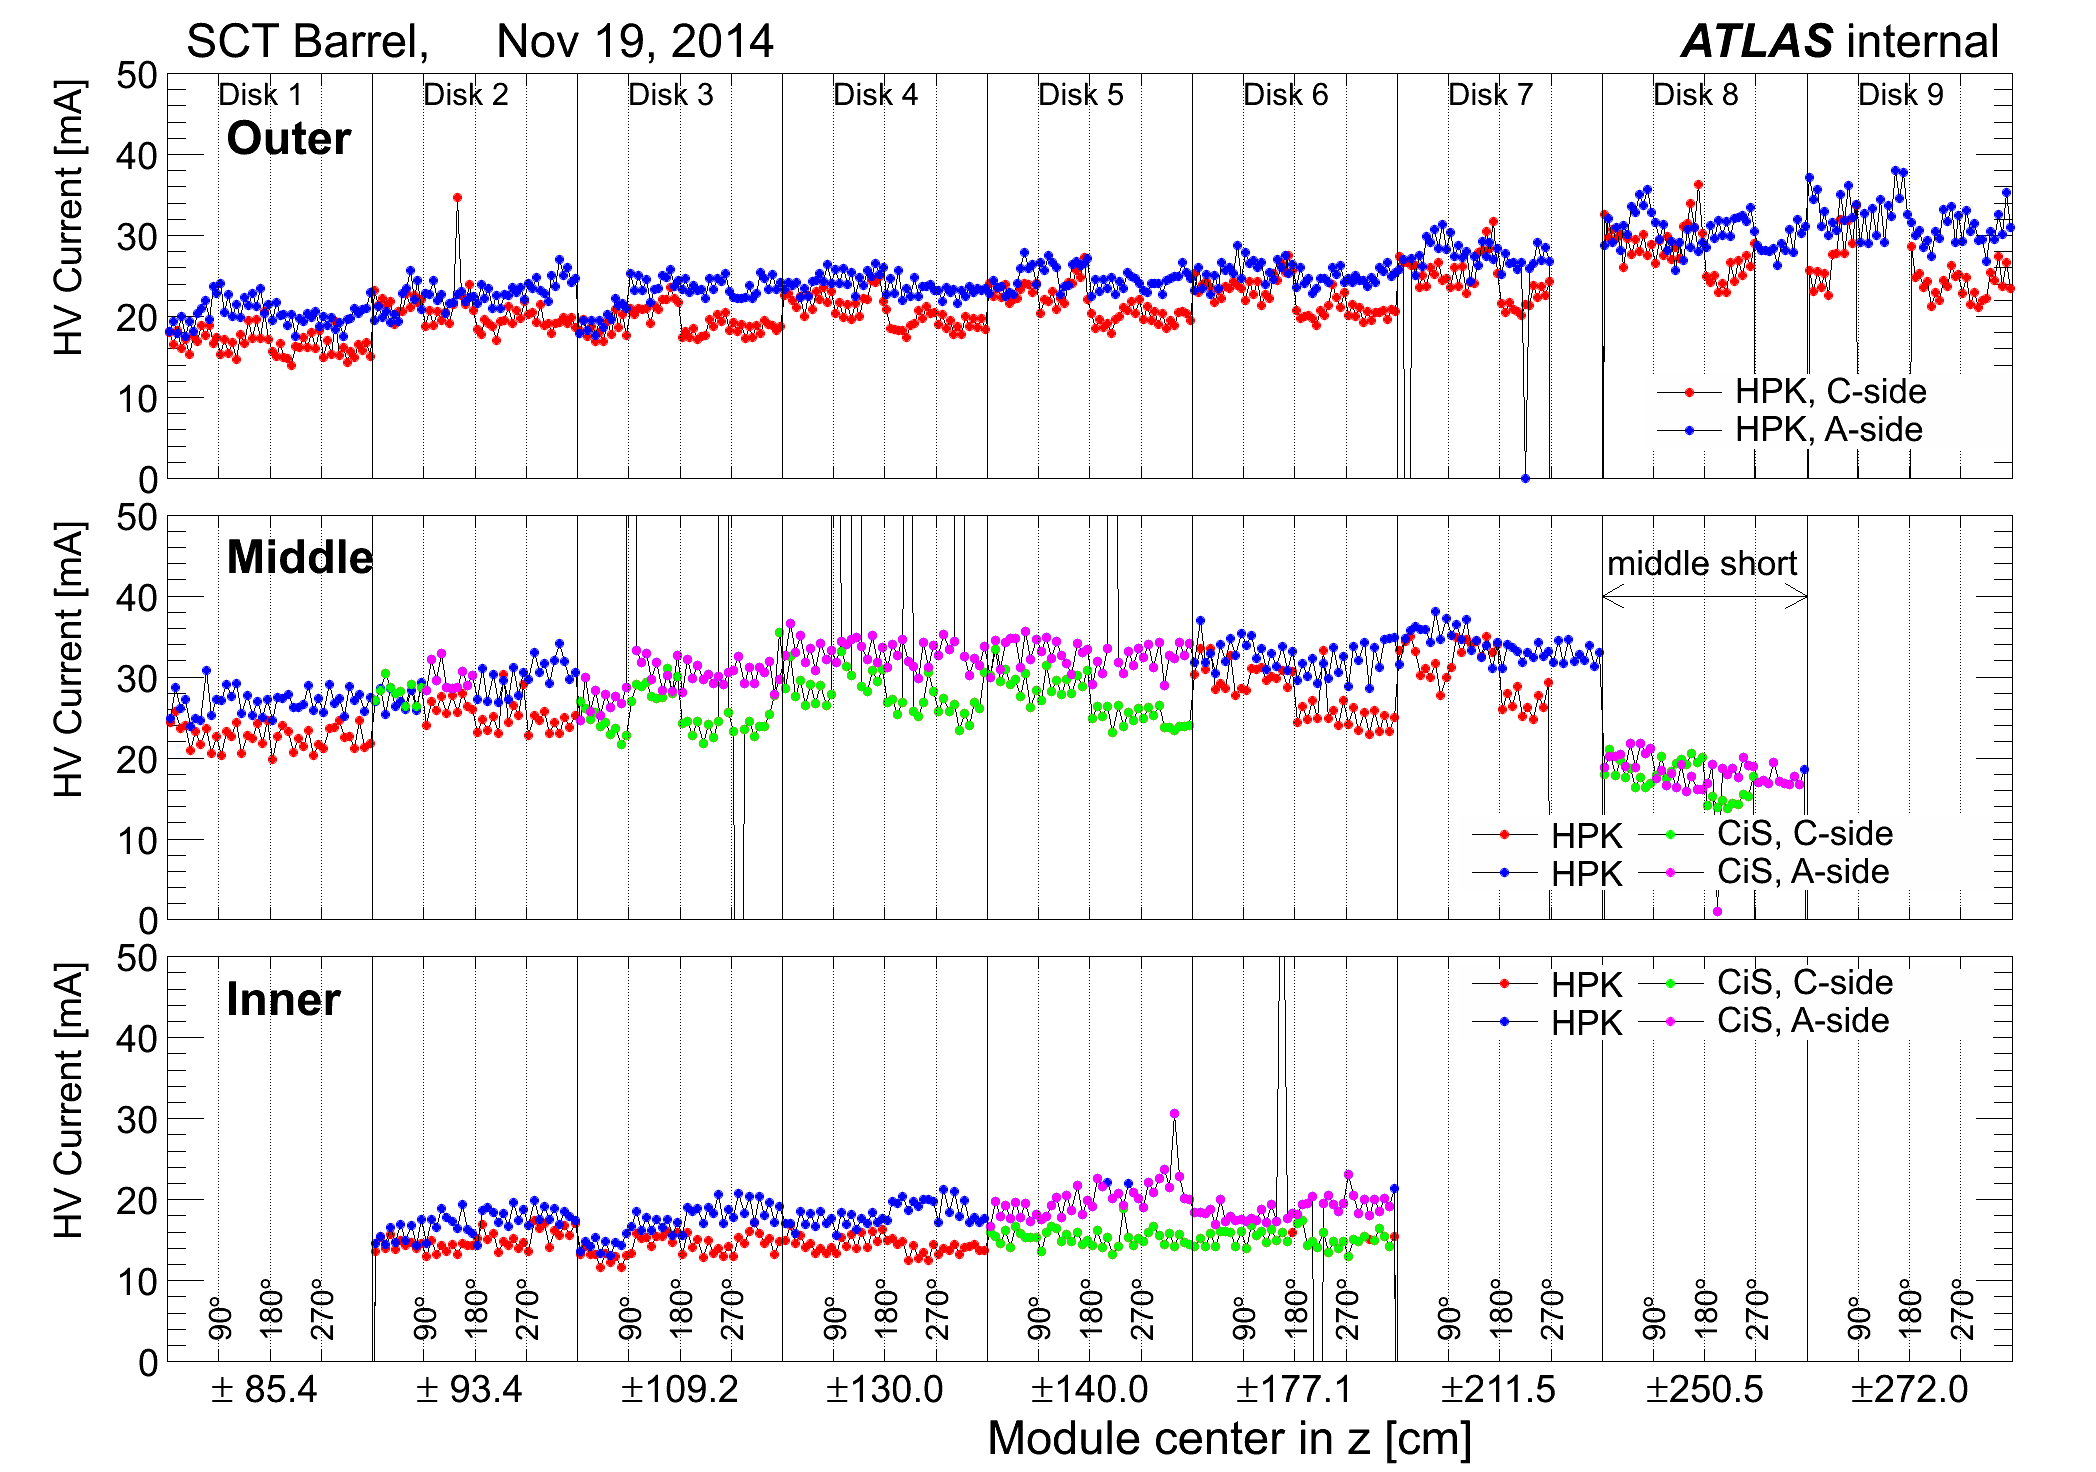
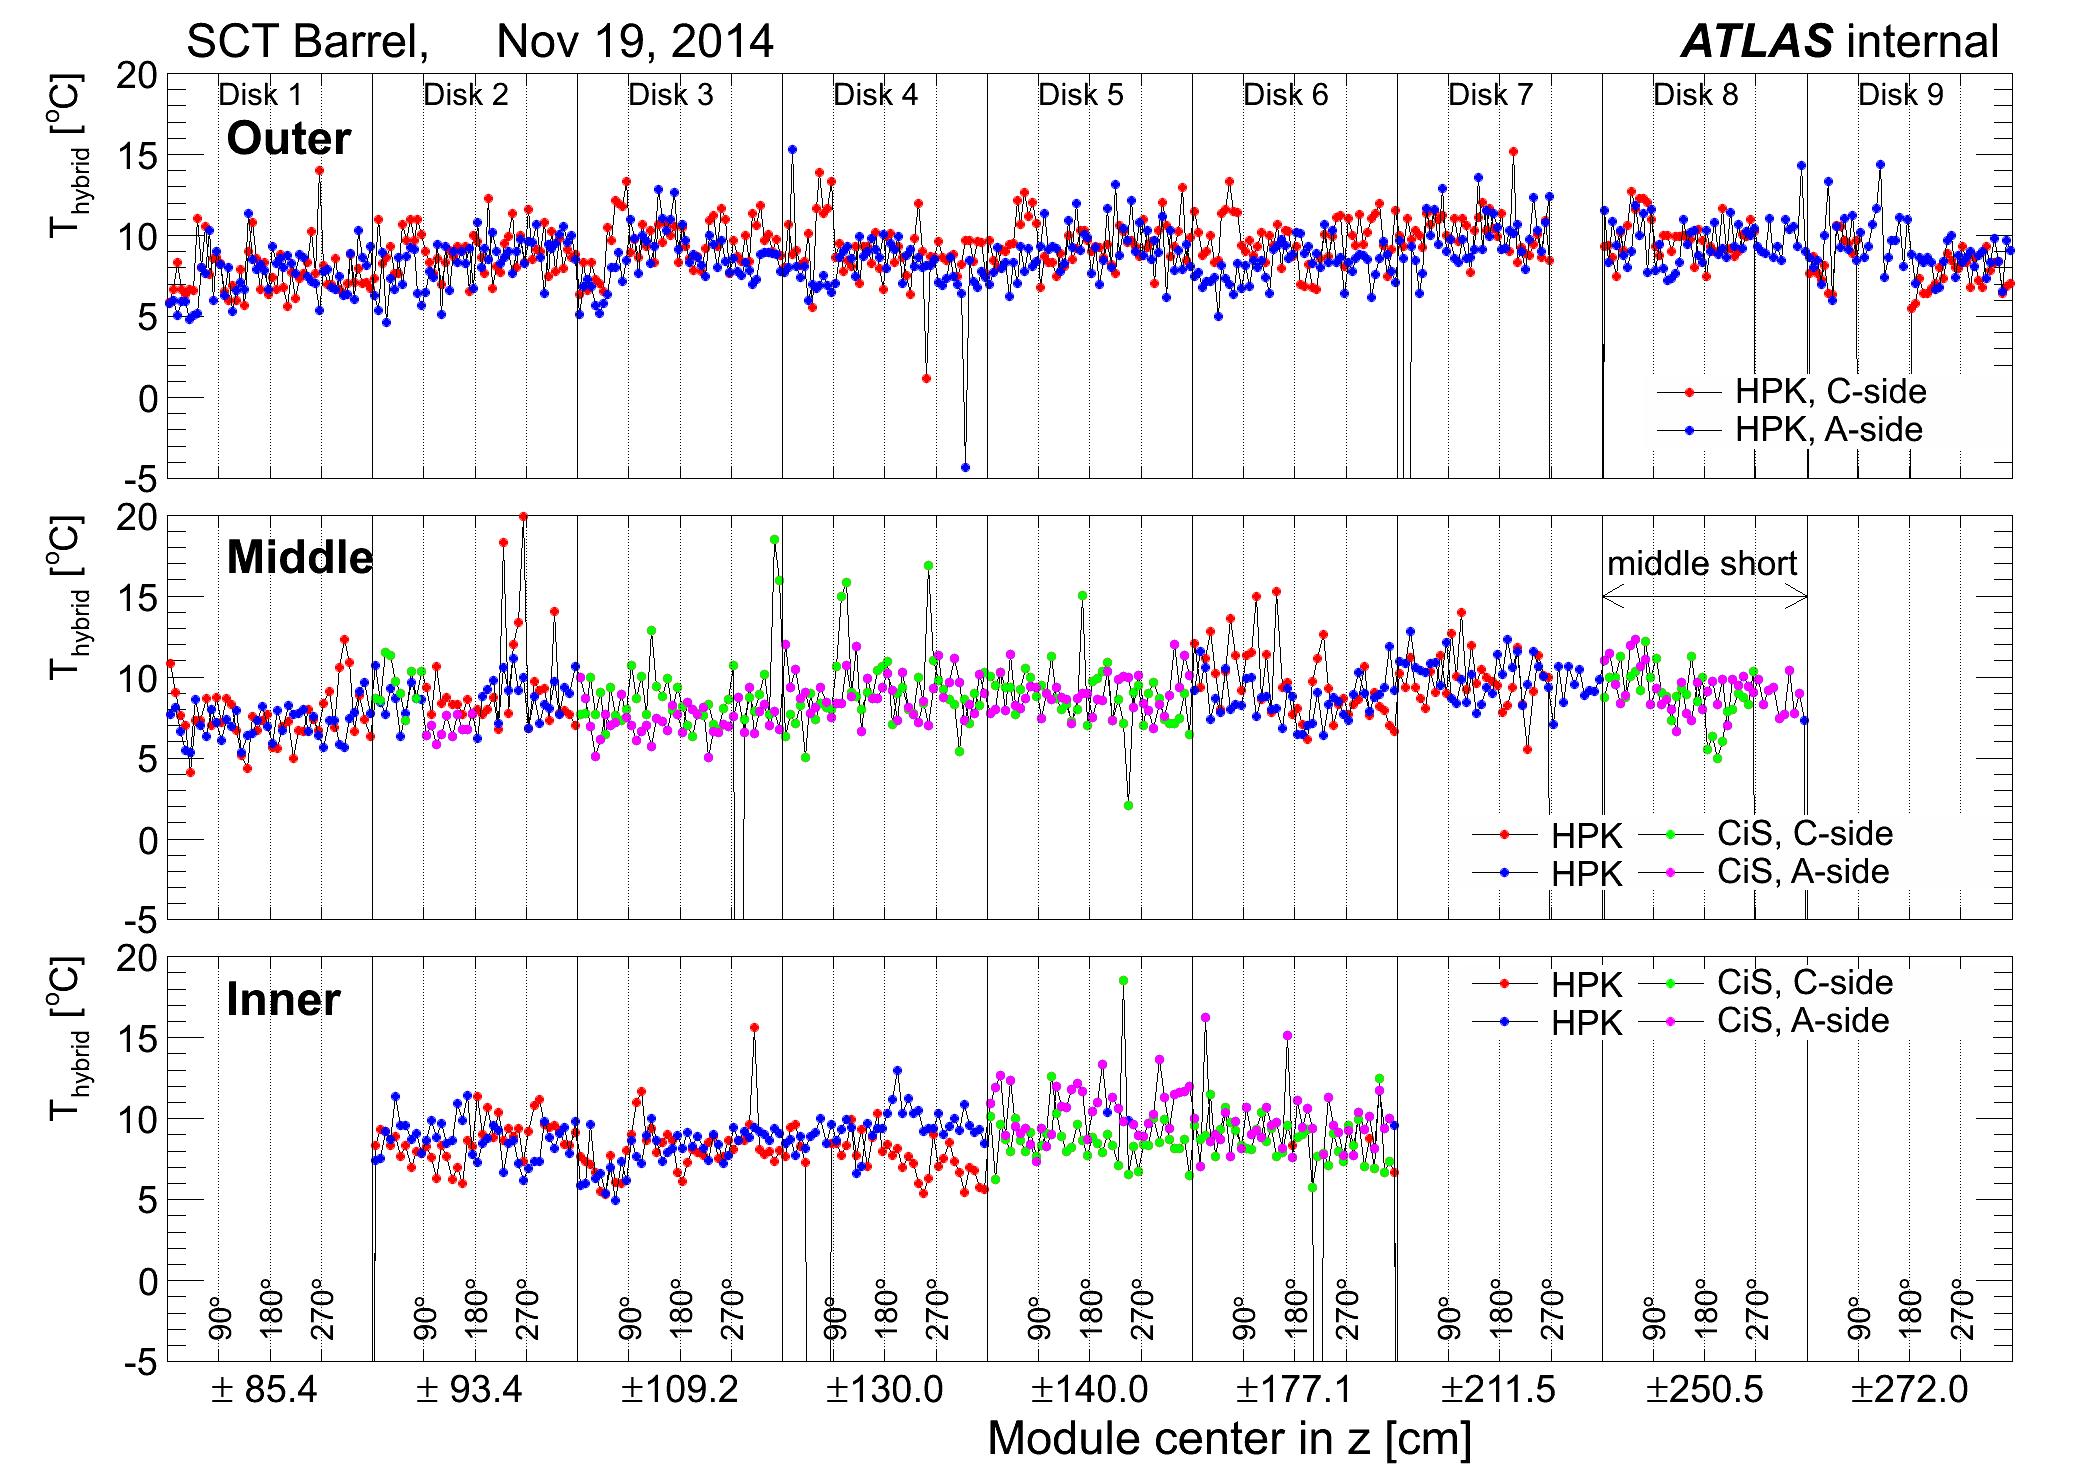
- Endcap分布:module_DB_100CiS.txtをコピーしておく。ROOT を起動してplot_dcsDB_Endcap.C(中でTYPE=1,2,3を指定する)を走らせれば、HV分布, HVchCurr分布, 温度分布が出る。
[2] COOLデータベースを使う方法
- getHVRaw.py, getTempRaw.py をlxplus.cern.chの自分の作業directoryにコピーする。
- 8-10行目の日時、レイヤー指定を行う:
Start='2012-11-04 00:00:00' #UTC time
End ='2012-11-07 00:00:00' #UTC time
bar0 = 3
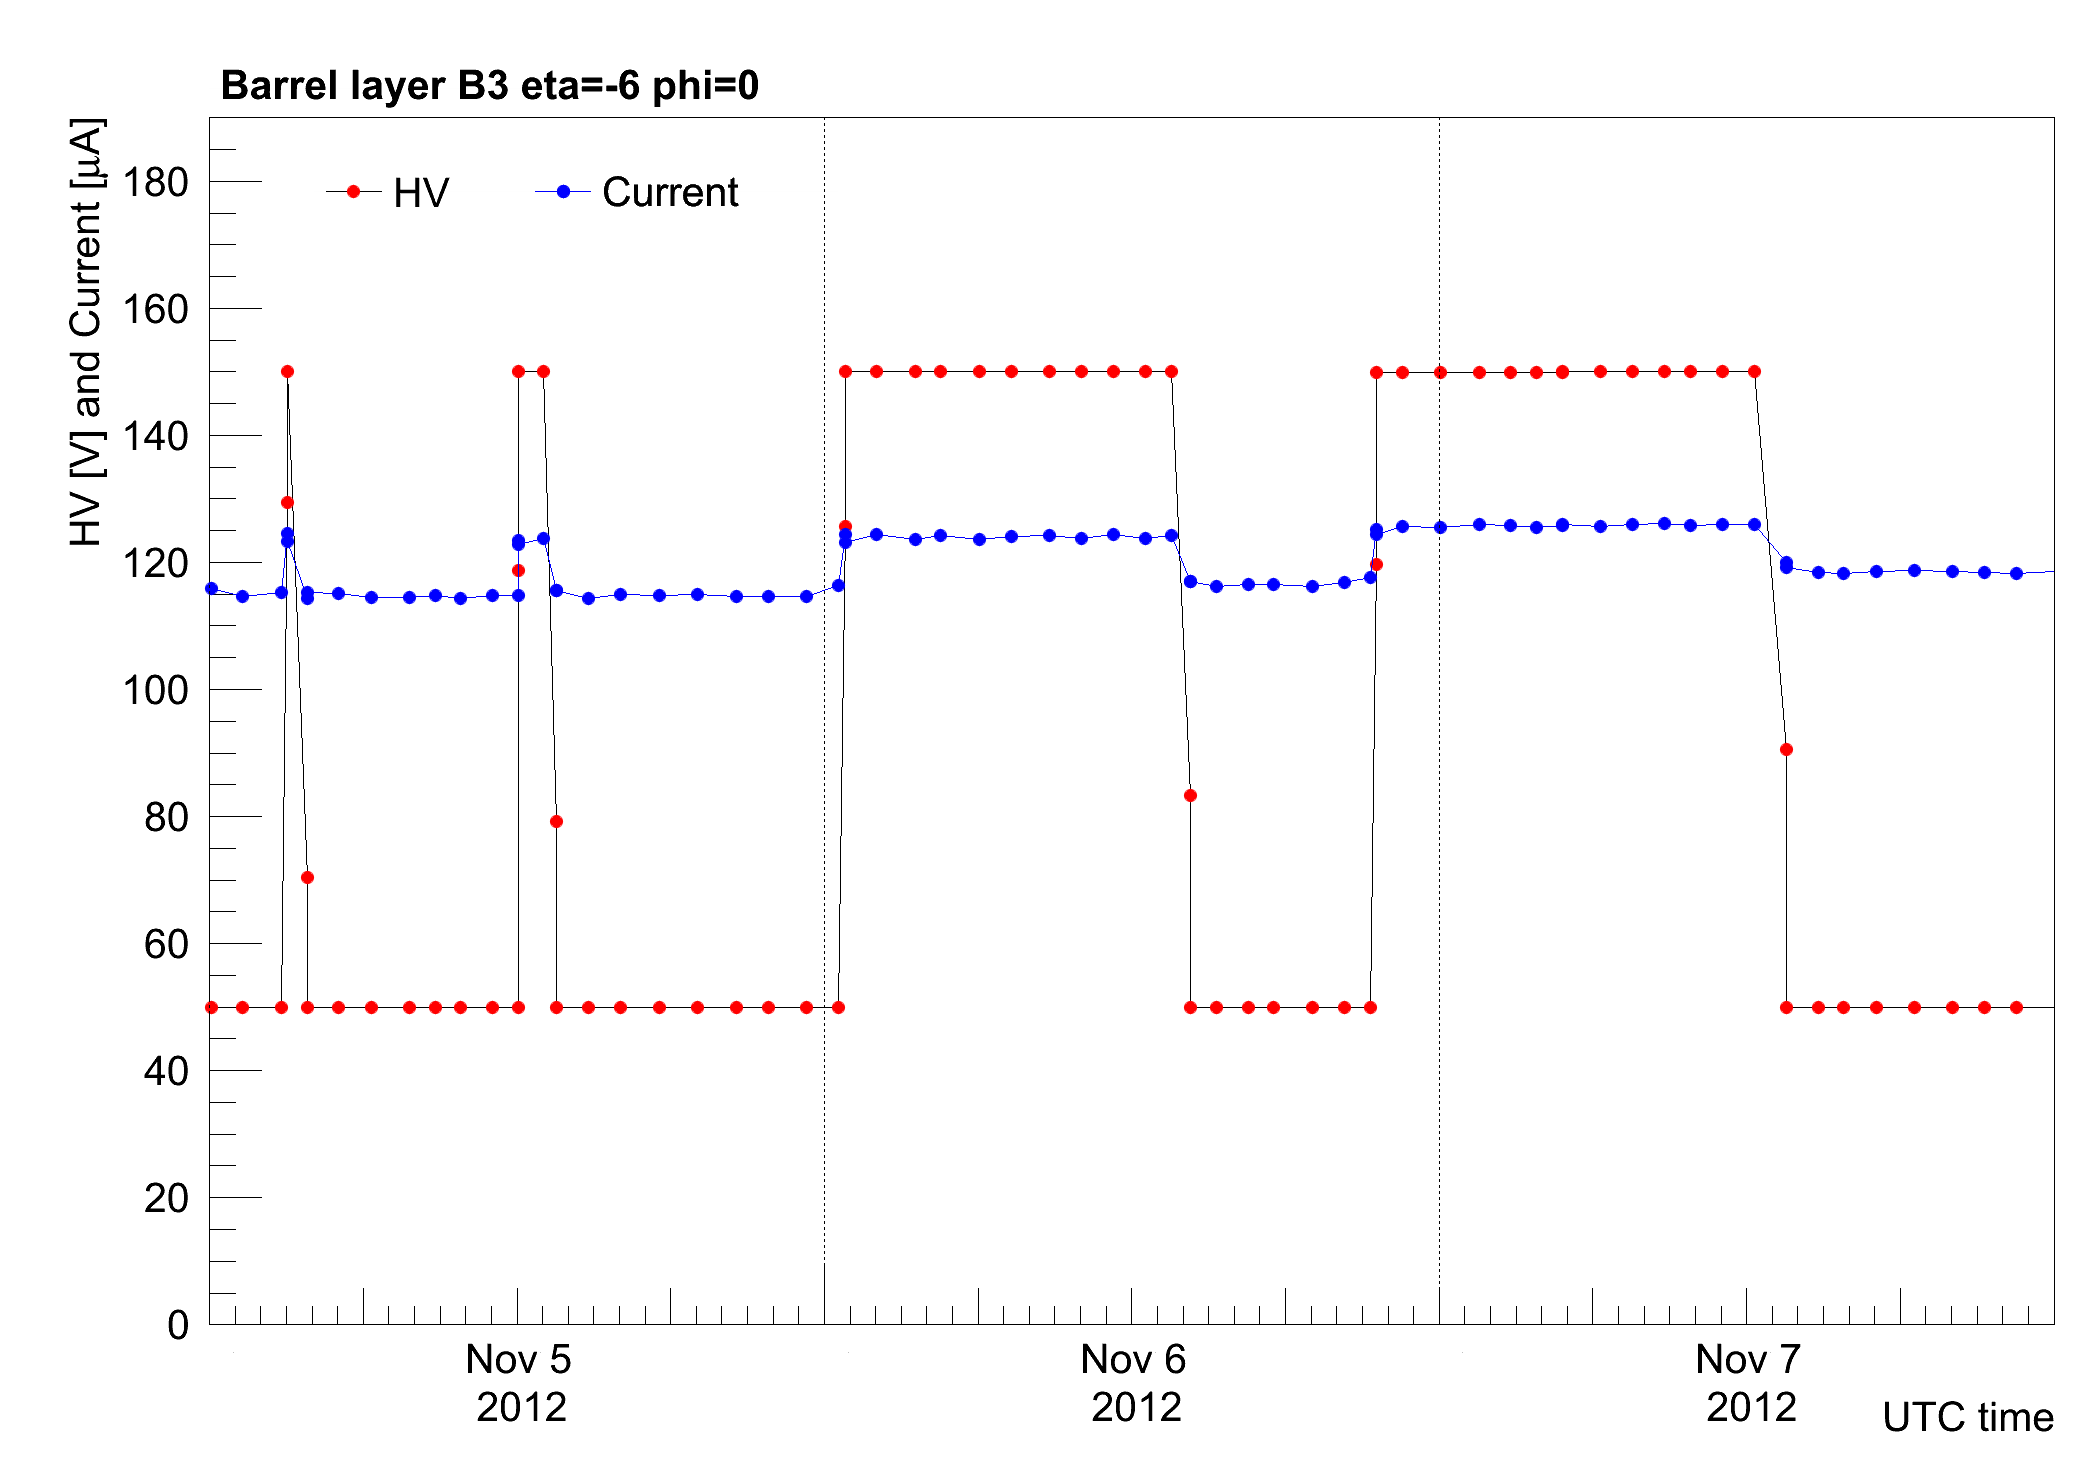
- python getHVRaw.py で走らせると、以下のようにHVとHVCurrentの情報が入ったテキストファイルrawHVB3_2012-11-04.txtが生成される。
----------------------------------------
ed layer eta phi year month day UTCHourMinSec HV HVcurrenti
1 3 -6 0 2012 11 04 000317 50 115918
1 3 -6 0 2012 11 04 011727 50 114698
1 3 -6 0 2012 11 04 024731 50 115206
.
.
1 3 6 31 2012 11 06 214751 50.125 116070
1 3 6 31 2012 11 06 230258 50.125 115765
----------------------------------------
数字は以下を意味している:
1(barrel) 3(Barrel 3) -6(eta=-6) 0(phi) 2012(year) 11(month) 04(day) 00(hour)03(min)17(sec) 49.875(HV[Volt]) 115918(HVcurrent[nA])
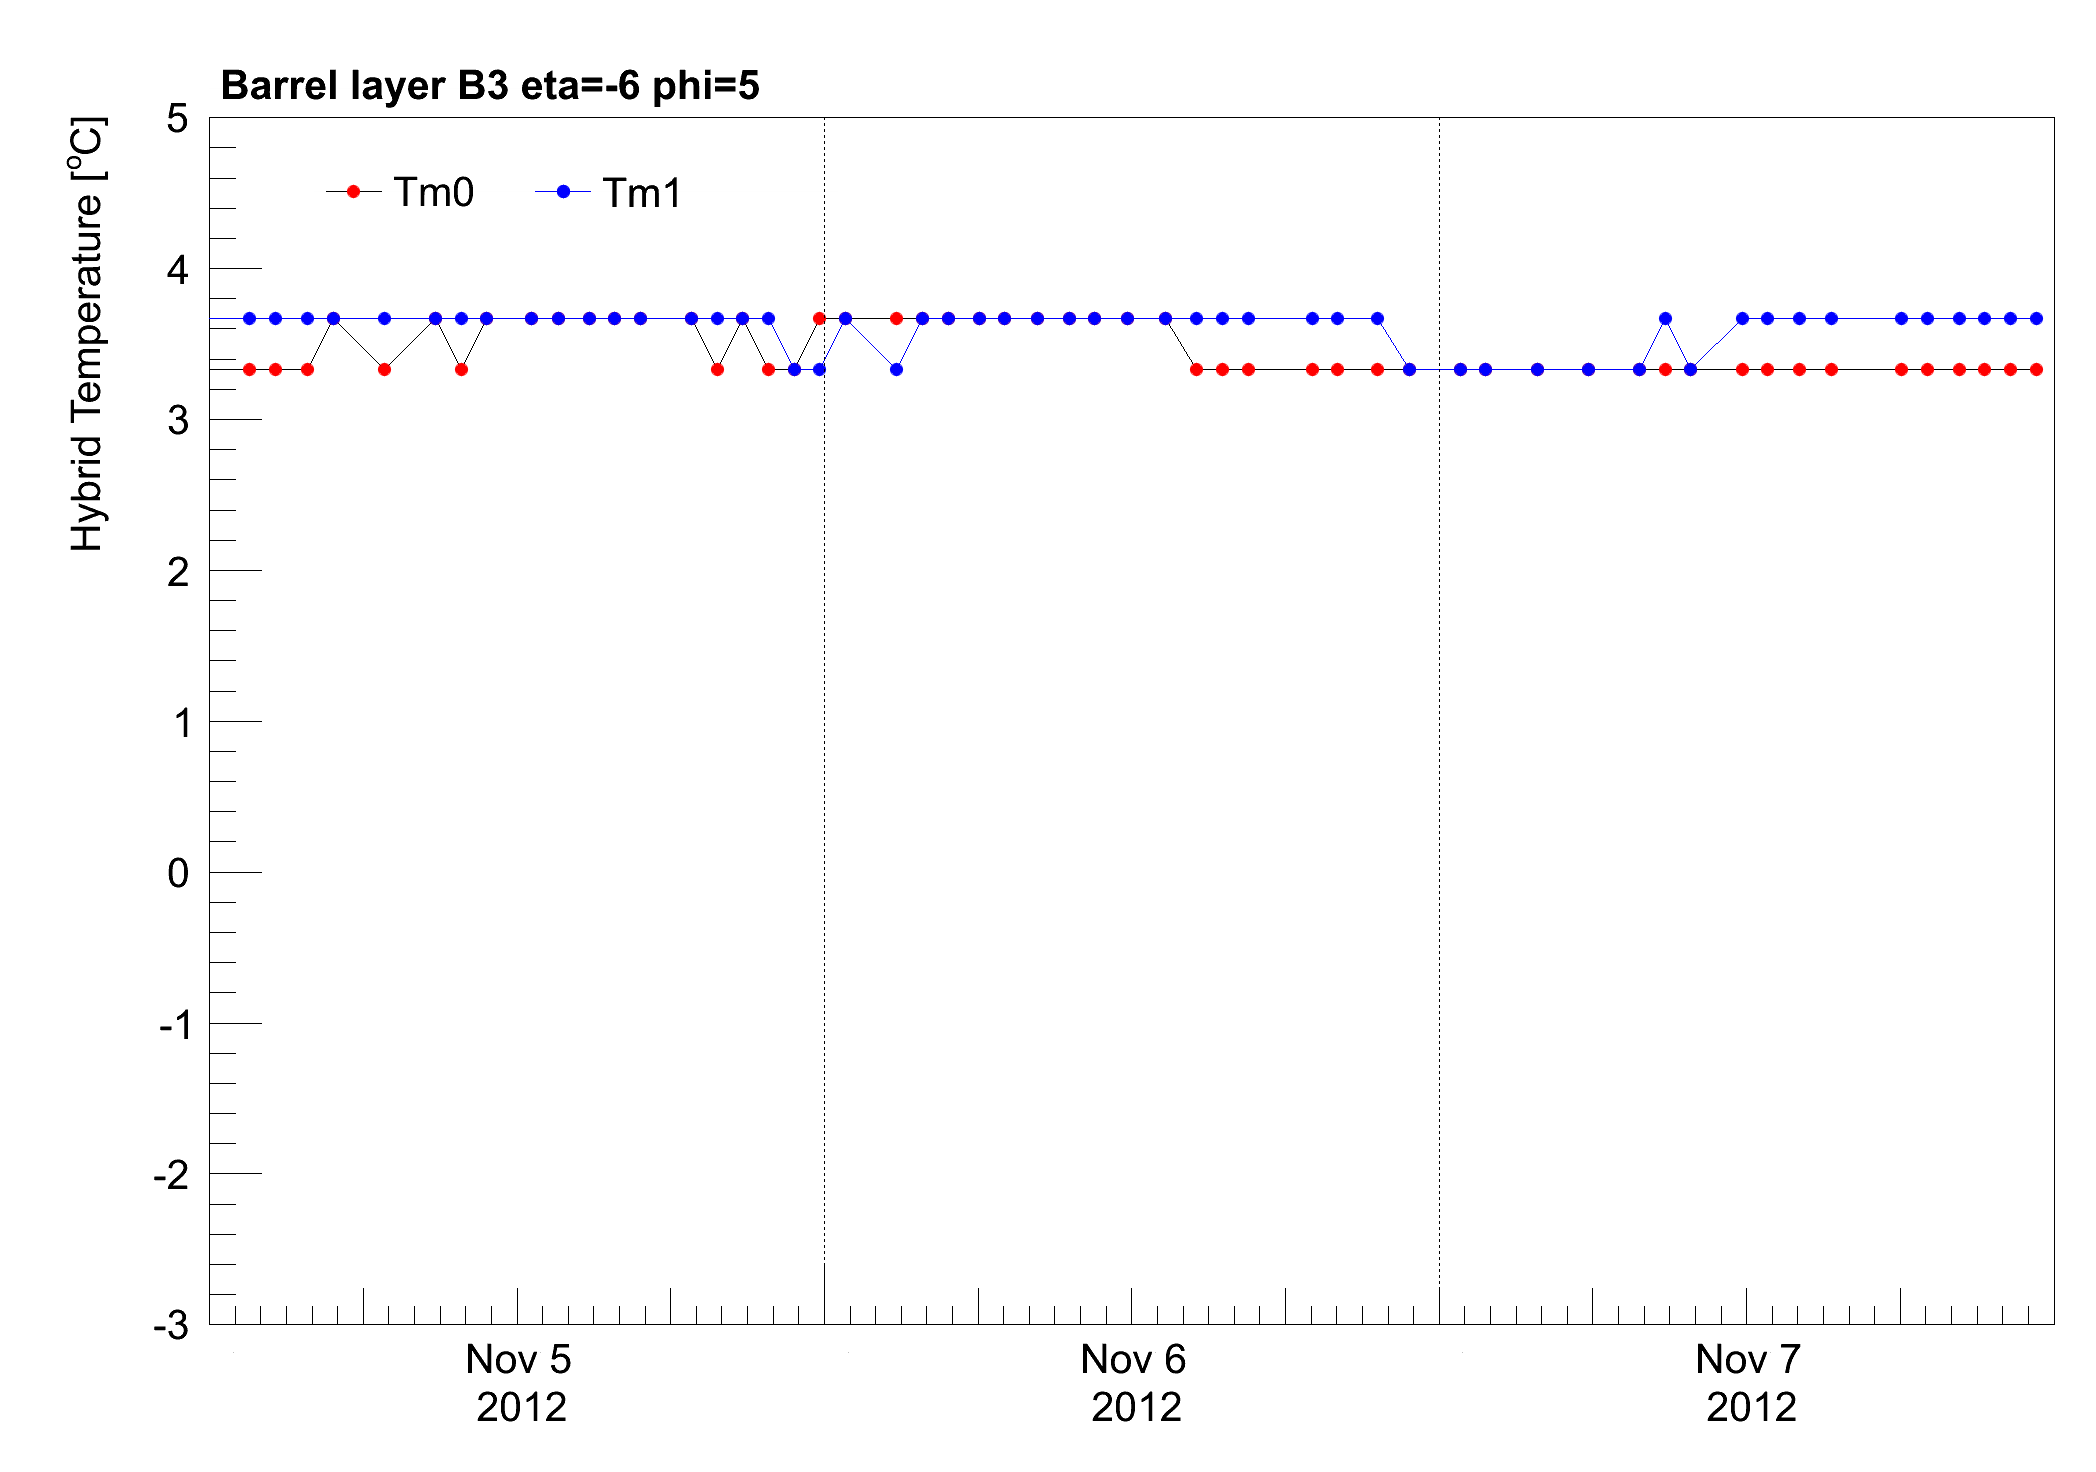
- 同様にpython getTempRaw.py で温度のテキストファイル rawTempB3_2012-11-04.txt などが生成される。
- ROOTが走るパソコン上でplot_HVCurrent_time.Cを
root -b でrootの中に入り
.x plot_HVCurrent_time.C
と走らせればHV_time_B3_2012-11-04_0.pngなどのプロットが作られる。
- 同様に温度もplot_Temperature_time.CをROOT内で走らせればTemp_time_B3_2012-11-04_5.pngなどのプロットが作られる。
参考:ROOTの使い方を自分用にメモしたROOTコマンド集ページがあります。参考になれば。。。。