ATLAS SCT Digitization: map of induced current
2019.3.8 Taka Kondo (KEK)
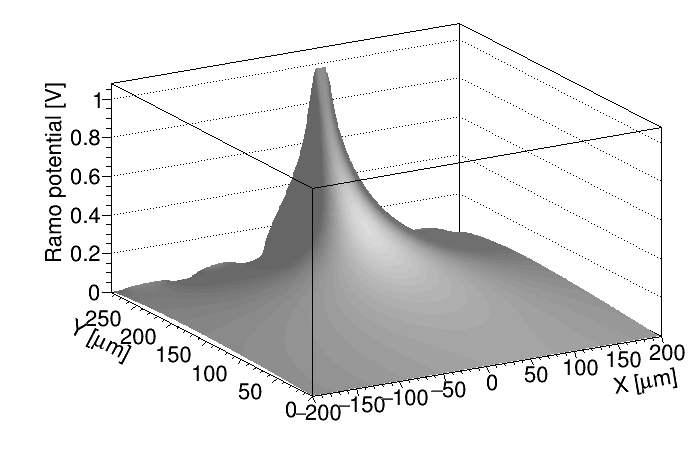
Ramo potential
2019.3.7
root -l -b -q plot_RamoPotential.C makes 
Mapping proposal(version-6)
2010.10.24
VD=70V, VB=150V, T=273.15K ***** BEING UPDATED after bug fixing (2010.9.24 and 10.23) ********
| model | B(Tesla) | diffusion | sources
| Charge (2.5um)
| Charge (1.0um)
| charge profiles
|
|---|
| induced current model | -2 | yes
| hole+elec
| GetCharge_11.cxx
| GetCharge_21.cxx
| charge_2.5um.png
|
| induced current model | -2 | no
| hole+elec
| GetCharge_12.cxx
| GetCharge_22.cxx
| ChargeProfiles_12
|
| induced current model | 0 | yes
| hole+elec
| GetCharge_13.cxx
| GetCharge_23.cxx
| ChargeProfiles_13
|
| induced current model | -2 | yes
| holes
| GetCharge_14.cxx
| GetCharge_24.cxx
| ChargeProfiles_14
|
| induced current model | -2 | yes
| electrons
| GetCharge_15.cxx
| GetCharge_25.cxx
| ChargeProfiles_15
|
| SCT Digitizatiion model | -2 | yes
| hole+elec
| GetCharge_111.cxx
| GetCharge_121.cxx
| ChargeProfiles_111
|
| SCT Digitizatiion model | -2 | no
| hole+elec
| GetCharge_112.cxx
| GetCharge_122.cxx
| ChargeProfiles_112
|
| SCT Digitizatiion model | 0 | yes
| hole+elec
| GetCharge_113.cxx
| GetCharge_123.cxx
| ChargeProfiles_113
|
Mapping proposal(version-3) with new x coordinates
2010.8.3
See MappingProposal_v3.pdf for changes.
Programmes/data for the sample point (B=2 tesla, VB=150 V, VD=65 V, T=0oC)
run/MySCTtestmap_v3.py
SCT1/MySCTtestmap_v3.h
src/MySCTtestmap_v3.cxx
look-up tables (mappingStep size)[Size]:
Mapping proposal(version-2) raw induced current (no amplification)
See MappingProposal_v2.pdf for explanation
Programmes/data for the sample point (B=2 tesla, VB=150 V, VD=65 V, T=0oC)
 run/MySCTtestmap_v2.py
SCT1/MySCTtestmap_v2.h
src/MySCTtestmap_v2.cxx
src/GetCharge150V.cxx
src/components/SCT1_load.cxx
src/components/SCT1_entries.cxx
cmt/requirements
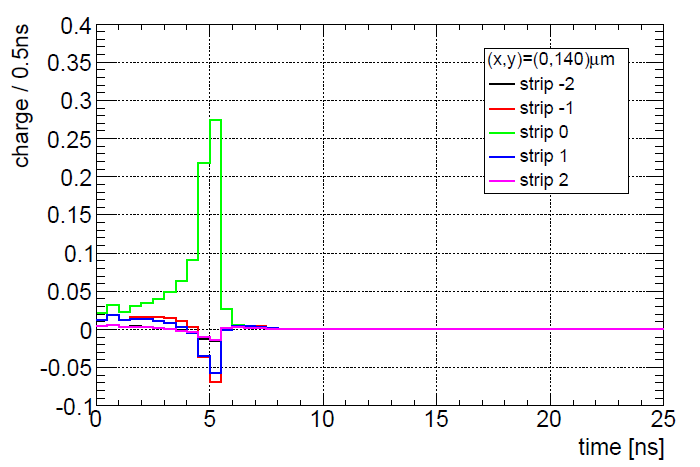
ROOT program to plot : plot_charge.C ->
example: inducedCharge-1.png
Mapping proposal(version-1)
See MappingProposal.pdf for explanation
Programmes/data for the sample point (B=2 tesla, VB=150 V, VD=65 V, T=0oC)
 run/MySCTtestmap.py
SCT1/MySCTtestmap.h
src/MySCTtestmap.cxx
src/GetPulse150V.cxx
src/components/SCT1_load.cxx
src/components/SCT1_entries.cxx
cmt/requirements
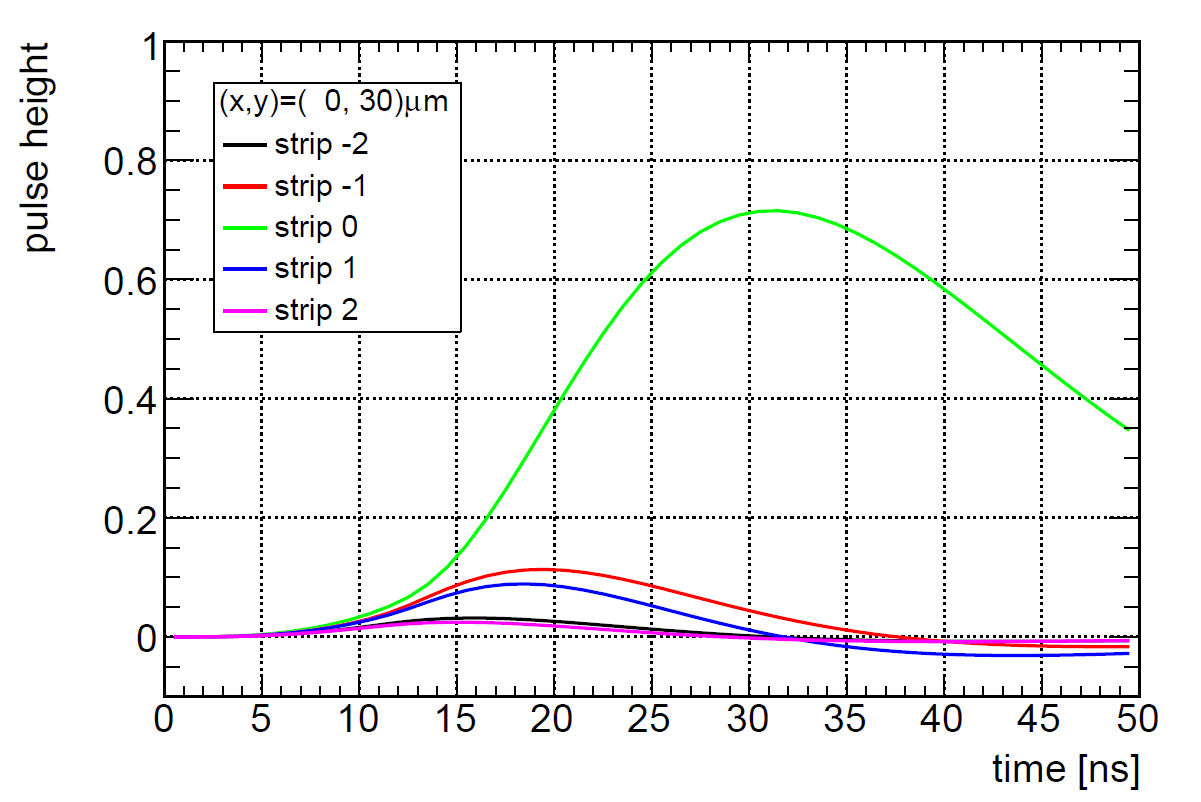
ROOT program to plot : plot_pulse.C ->
example: induced_1.png


